
Beschreibung
Willkommen bei Economic Calendar ChartAlert!
Müde davon, ständig zwischen Ihrer Handelsplattform und einem Webbrowser hin- und herzuwechseln, um die Nachrichten zu überprüfen? Economic Calendar ChartAlert bringt den globalen Wirtschaftskalender direkt in Ihre cTrader-Charts. Entwickelt für Daytrader und Swingtrader gleichermaßen, sorgt dieser Indikator dafür, dass Sie nie von Nachrichten mit hoher Auswirkung überrascht werden.
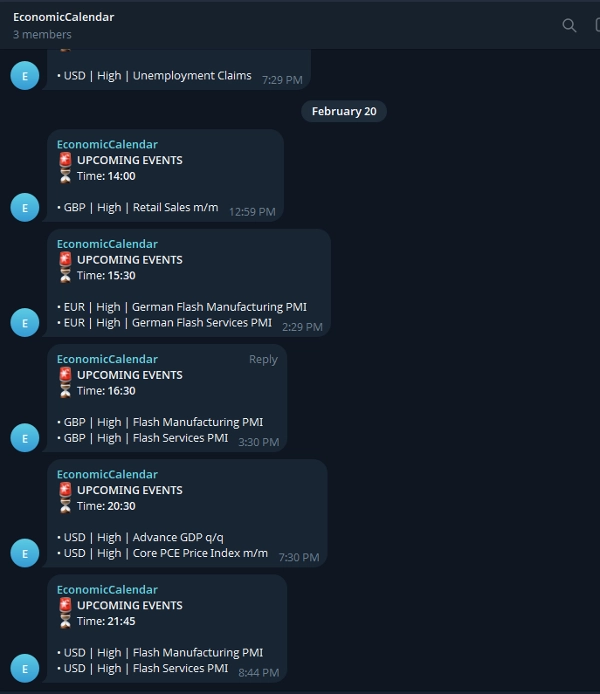
Er zeigt nicht nur elegant bevorstehende Ereignisse auf Ihrem Bildschirm an, sondern verfügt auch über eine integrierte Telegram-Integration, die genau 1 Stunde vor wichtigen Ereignissen eine Benachrichtigung an Ihr Telefon/Desktop sendet.
Hauptmerkmale:
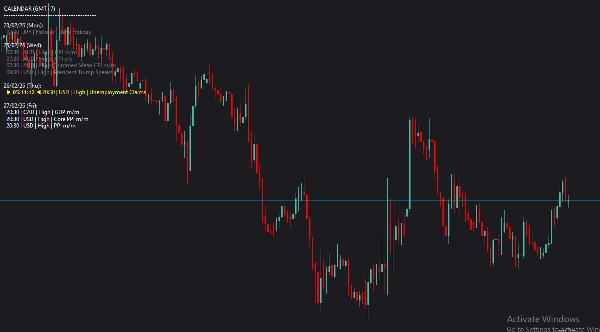
- 📊 Overlay im Chart: Saubere, moderne und unaufdringliche Textanzeige mit der Schriftart Roboto.
- 🔔 Automatisierte Telegram-Benachrichtigungen: Erhalten Sie Benachrichtigungen in Ihrem persönlichen Chat oder in Gruppen, bevor die Nachrichten eintreffen.
- 🎯 Intelligente Filterung: Sehen Sie nur die Nachrichten, die für Ihre Strategie relevant sind. Filtern Sie nach bestimmten Währungen oder Auswirkungsstufen.
- 🎨 Visuelle Farbkennzeichnung: Erkennen Sie sofort vergangene Ereignisse, das nächstgelegene bevorstehende Ereignis (hervorgehoben) und zukünftige Ereignisse.
⚙️ Einrichtungsanleitung & Parametererklärungen
Sobald Sie den Indikator an Ihr Chart anfügen, können Sie die folgenden Parameter an Ihren Handelsstil anpassen:
Visuelle Einstellungen:
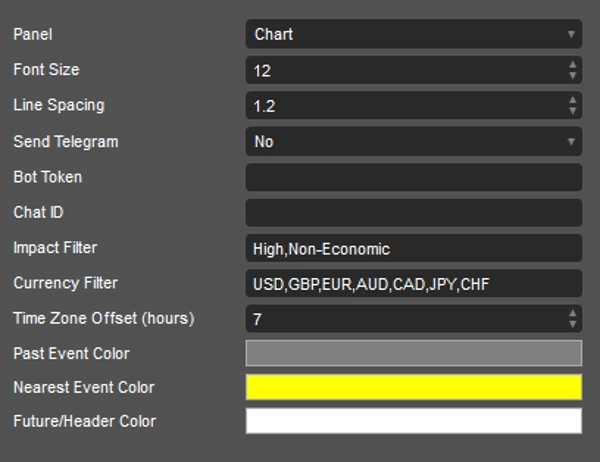
- Schriftgröße & Zeilenabstand: Passen Sie die Größe und den Abstand des Textes an, damit er auf Ihrer spezifischen Monitorauflösung perfekt aussieht.
Telegram-Einstellungen:
- Telegram senden: Umschalten auf
Yes, wenn Sie Benachrichtigungen erhalten möchten. (Benachrichtigungen werden ca. 1 Stunde vor dem Ereignis gesendet). - Bot-Token: Fügen Sie den HTTP-API-Token Ihres Telegram-Bots ein (erstellt über BotFather).
- Chat-ID: Geben Sie Ihre persönliche Chat-ID oder die ID der Telegram-Gruppe/des Kanals ein, an die die Benachrichtigungen gesendet werden sollen.
Filtereinstellungen (entscheidend für ein sauberes Chart):
- Auswirkungsfilter: Geben Sie die genauen Auswirkungsstufen ein, die Sie sehen möchten, getrennt durch Kommas (Standard:
High,Non-Economic). Verwenden SieAll, um alles anzuzeigen. - Währungsfilter: Definieren Sie, welche Währungen Sie handeln (Standard:
USD,GBP,EUR,AUD,CAD,JPY,CHF). Verwenden SieAllfür alle Währungen. - Zeitzonen-Offset (Stunden): Passen Sie dies an Ihre lokale Zeitzone an. Zum Beispiel verwenden Sie
7für GMT+7.
Farben:
- Farbe für vergangene Ereignisse: Farbe für Ereignisse, die heute bereits stattgefunden haben (Standard: Grau).
- Farbe für das nächste Ereignis: Hebt das unmittelbar nächste bevorstehende Ereignis hervor, damit es ins Auge fällt (Standard: Gelb).
- Farbe für zukünftige/Ereignisüberschriften: Farbe für die Kalenderüberschriften und bevorstehende Ereignisse (Standard: Weiß).
Handeln Sie klug, bleiben Sie informiert und lassen Sie die Charts die Arbeit für Sie erledigen!
Zusammenfassung
The indicator features automated Telegram alerts, sending notifications approximately one hour before high-impact events to personal chats or groups via a configurable Telegram Bot. Visual settings allow adjustment of font size and line spacing for optimal display on various monitors. Time zone offset can be set to match local time.
Key functionalities include on-chart event display, smart filtering by currency and impact, color-coded event visualization, and Telegram integration for timely alerts. Supported markets and symbols include Forex, indices, commodities, and cryptocurrencies such as BTCUSD, EURUSD, GBPUSD, USDJPY, and XAUUSD. This tool aids traders in staying informed of critical economic news without leaving their trading platform.
Kundenbewertungen
5 | 100 % | |
4 | 0 % | |
3 | 0 % | |
2 | 0 % | |
1 | 0 % |


![„[Stellar Strategies] Market Session Ultimate“-Logo](https://cdn.ctrader.com/image/webp/61ffd537-0125-4246-9e72-42eca1791d64_28232)


