
Beschreibung
Der HIO Multi-Currency Stochastic Scanner ist ein fortschrittlicher Dashboard-Indikator, der entwickelt wurde, um Ihre Marktanalyse zu vereinfachen. Anstatt dutzende Charts zu öffnen, ermöglicht Ihnen dieses Tool, den Stochastik-Oszillator über mehrere Symbole und Zeitrahmen gleichzeitig von einem einzigen Panel aus zu überwachen. Es unterstützt Trader dabei, potenzielle Marktbedingungen effizient zu identifizieren, spart Zeit und hält Ihren Arbeitsbereich organisiert.
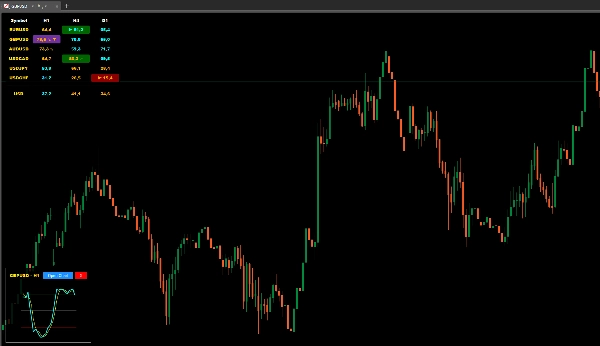
Hauptmerkmale
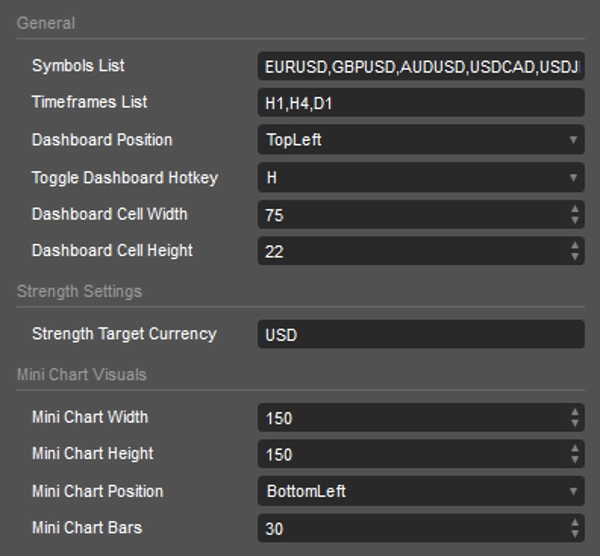
- Multi-Symbol- & Zeitrahmen-Überwachung: Verfolgen Sie bis zu dutzende Währungspaare über Ihre gewählten Zeitrahmen in einem übersichtlichen Raster.
- Interaktive Mini-Charts: Klicken Sie auf eine beliebige Zelle, um ein Pop-up-Mini-Chart zu öffnen, das Ihnen ermöglicht, die Stochastik-Linien und K/D-Kreuzungen sofort zu visualisieren, ohne Ihr aktuelles Chart zu verlassen.
- Währungsstärke-Messgerät: Verfügt über eine eigene Zeile zur Berechnung der gewichteten Stärke einer Zielwährung (z. B. USD) basierend auf Stochastik- und Volumendaten.
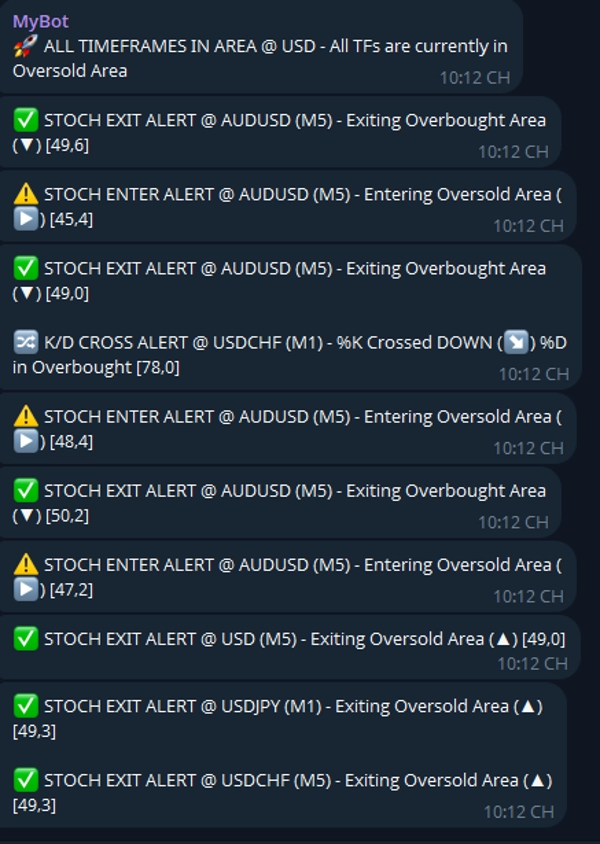
- Umfassende Benachrichtigungen: Unterstützt Telegram-Benachrichtigungen für das Betreten/Verlassen von Überkauft- (OB) und Überverkauft-Bereichen (OS) sowie K/D-Kreuzungen.
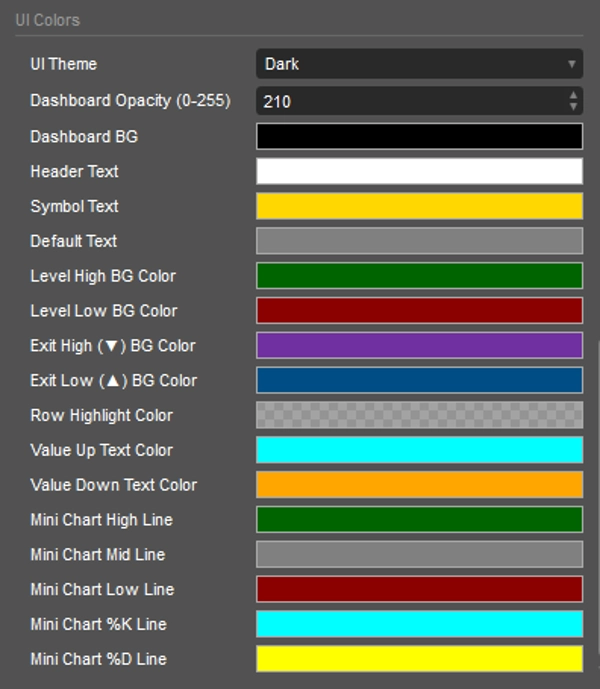
- Anpassbare Benutzeroberfläche: Wählen Sie zwischen Dunkel-, Hell- oder benutzerdefinierten Themen. Schalten Sie die Dashboard-Sichtbarkeit sofort mit einer Hotkey um.
Einrichtung & Parameter
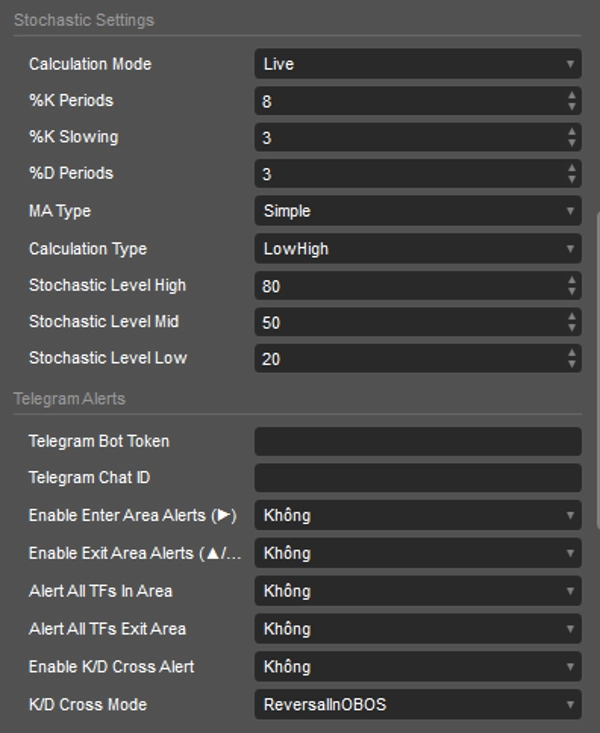
- Allgemein: Definieren Sie Ihre
Symbols List(durch Kommas getrennt) undTimeframes List. Legen Sie dieToggle Dashboard Hotkeyfest (Standard ist 'H'). - Stochastik-Einstellungen: Passen Sie vollständig die
%K Periods,%K Slowing,%D PeriodsundMA Typean, um Ihre Strategie anzupassen. Passen Sie OB/OS-Grenzen überStochastic Level HighundStochastic Level Lowan. - Telegram-Benachrichtigungen: Geben Sie Ihren
Telegram Bot TokenundChat IDein. Aktivieren Sie spezifische Alarmauslöser wie Bereich Betreten/Verlassen oder K/D-Kreuzungsmodus (Umkehr, Fortsetzung, Neutralzone usw.).
Symbole & Farberklärung
- Farben:
-
- Dunkelgrüner Hintergrund: Symbol befindet sich im Überkauften Bereich.
- Dunkelroter Hintergrund: Symbol befindet sich im Überverkauften Bereich.
- Aqua / Orangefarbener Text: Zeigt an, ob der Stochastik-Wert derzeit steigt (Aqua) oder fällt (Orange).
- Symbole:
-
- ▶ (Betreten): Der Preis betritt die Überkauft- oder Überverkauft-Zone.
- ▲ (Verlassen Tief): Der Preis verlässt die Überverkauft-Zone nach oben.
- ▼ (Verlassen Hoch): Der Preis verlässt die Überkauft-Zone nach unten.
- ↗ (Kreuz Aufwärts): Die %K-Linie hat die %D-Linie nach oben gekreuzt.
- ↘ (Kreuz Abwärts): Die %K-Linie hat die %D-Linie nach unten gekreuzt.
Der HIO Multi-Currency Stochastic Scanner ist ein robustes Workflow-Verbesserungstool für technische Trader. Durch die Zentralisierung wichtiger Momentum-Daten bietet er eine klarere makroökonomische Perspektive des Marktes und hilft Ihnen, fundierte Entscheidungen ohne Chart-Unordnung zu treffen.
Zusammenfassung
Kundenbewertungen
5 | 50 % | |
4 | 50 % | |
3 | 0 % | |
2 | 0 % | |
1 | 0 % |


![„[Stellar Strategies] MARSI Signal Plotter“-Logo](https://cdn.ctrader.com/image/webp/7b2b8da6-8f8e-4646-8d4a-4710c516c01e_25567)


