
Beschreibung
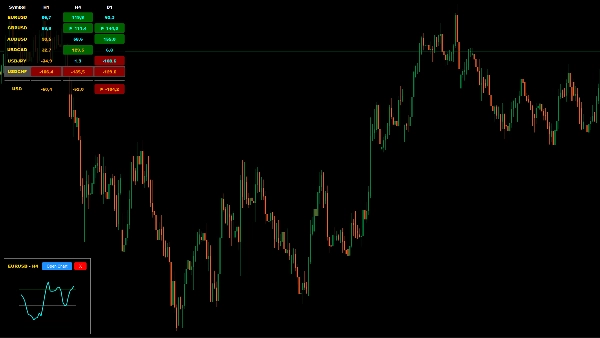
Der HIO Multi-Currency CCI Scanner ist ein benutzerdefinierter cTrader-Indikator, der entwickelt wurde, um Ihren Handelsarbeitsbereich zu optimieren. Anstatt zwischen mehreren geöffneten Charts zu navigieren, bietet dieser Indikator ein zentrales Dashboard, um die Commodity Channel Index (CCI)-Werte über mehrere Symbole und Zeitrahmen gleichzeitig zu überwachen. Er wurde entwickelt, um Händlern dabei zu helfen, potenzielle Marktextrme und Trendfortsetzungen von einem einzigen Panel aus zu identifizieren.
Hauptmerkmale
- Multi-Symbol- & Zeitrahmen-Matrix: Überwachen Sie benutzerdefinierte Symbole und Zeitrahmen innerhalb eines einzigen, einheitlichen Panels auf Ihrem cTrader-Chart.
- Berechnung der Währungsstärke: Verfügt über ein integriertes Messgerät, das die Zielwährungsstärke mithilfe eines volumenbasierten CCI-Algorithmus schätzt.
- Interaktive Mini-Charts: Klicken Sie auf eine beliebige Datenzelle im Dashboard, um ein schwebendes Mini-Chart zu öffnen, das es Ihnen ermöglicht, die detaillierte CCI-Linie zu sehen, ohne Ihren Hauptarbeitsbereich zu verlassen.
- Integrierte Telegram-Benachrichtigungen: Verbinden Sie Ihren Telegram-Bot, um Benachrichtigungen zu erhalten, wenn einzelne Zeitrahmen – oder eine Übereinstimmung aller Zeitrahmen – Ihre vordefinierten Extremzonen betreten oder verlassen.
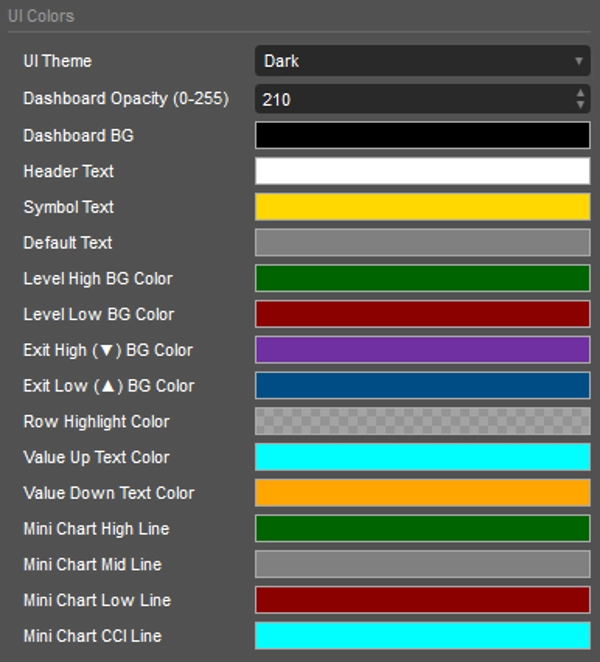
- Anpassbare Benutzeroberfläche: Vollständig anpassbares Design mit Licht-, Dunkel- oder benutzerdefinierten Farbthemen, um sich nahtlos in Ihre bevorzugte cTrader-Umgebung einzufügen.
Einrichtung & Parameter
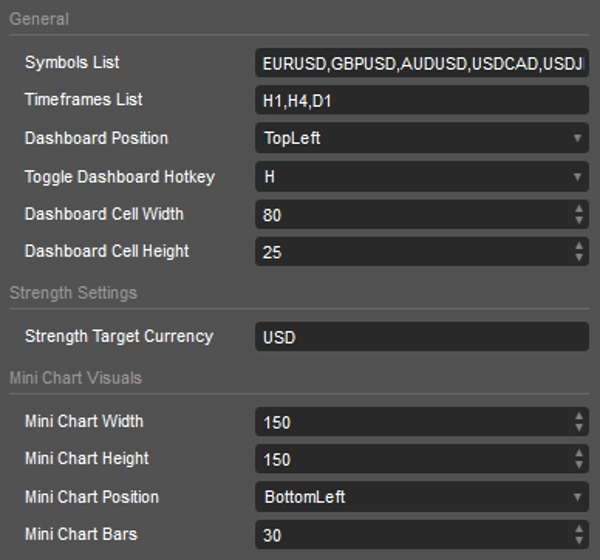
- Symbole & Zeitrahmen: Geben Sie Ihre gewünschten Assets und Zeitrahmen als durch Kommas getrennte Werte ein (z. B. EURUSD, GBPUSD und h1, h4, d1).
- Zielwährung: Definieren Sie die Basiswährung (z. B. USD) für die Berechnung des Stärkemessers.
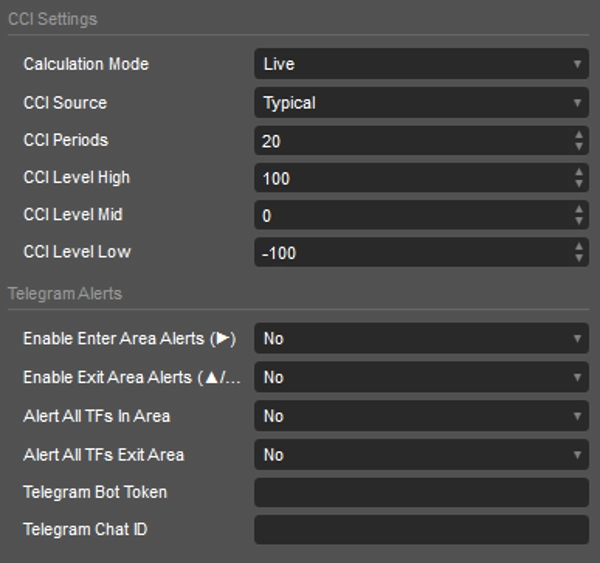
- CCI-Einstellungen: Passen Sie die Kernparameter an, einschließlich Berechnungsmodus (Live/Bar Close), Datenquelle (z. B. Close, High, Low), Perioden und spezifische Überkauft-/Überverkauft-Schwellenwerte.
- Alarmkonfiguration: Geben Sie Ihren Telegram-Bot-Token und Chat-ID ein, um Remote-Push-Benachrichtigungen zu aktivieren.
Dashboard-Legende (Farben & Symbole)
Das Dashboard verwendet visuelle Hinweise, um Momentum-Daten schnell zu vermitteln:
- Dunkelgrüner Hintergrund: Der CCI befindet sich derzeit in der Überkauft-Zone.
- Dunkelroter Hintergrund: Der CCI befindet sich derzeit in der Überverkauft-Zone.
- Lila/Blaue Hintergründe: Der CCI kreuzt aktiv zurück aus einer Extremzone heraus.
- ▶ (Eintritt): Das Momentum tritt aktiv in eine Extremgrenze ein.
- ▼ (Abwärts/Austritt): Verlassen der Überkauft-Zone, was auf potenzielles Abwärtsmomentum hinweist.
- ▲ (Aufwärts/Austritt): Verlassen der Überverkauft-Zone, was auf potenzielles Aufwärtsmomentum hinweist.
Hinweis: Dieses Tool ist für analytische Zwecke konzipiert, um Ihren technischen Analyse-Workflow innerhalb von cTrader zu unterstützen.
Zusammenfassung
Kundenbewertungen
5 | 50 % | |
4 | 50 % | |
3 | 0 % | |
2 | 0 % | |
1 | 0 % |


![„[Hamster-Coder] Bollinger Bands“-Logo](https://cdn.ctrader.com/image/webp/21d8e5d6-fb11-4bac-b9ee-cd05c2b76804_30327)


![„Smart Money Concepts (SMC) [Iridio Capital]“-Logo](https://cdn.ctrader.com/image/webp/28b69fd1-ef54-4bed-9487-07e78e883be4_40934)
