
True Trend H4
Indikator
2 käufe
Version 1.0, Jun 2025
Windows, Mac
4.0
Bewertungen: 1
Beschreibung
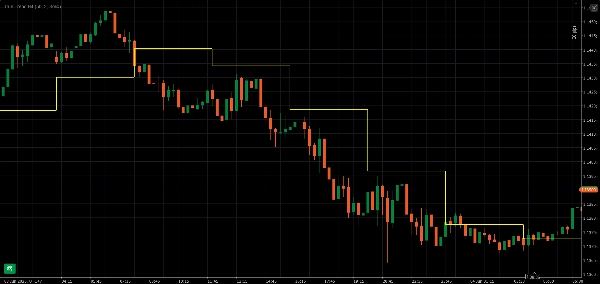
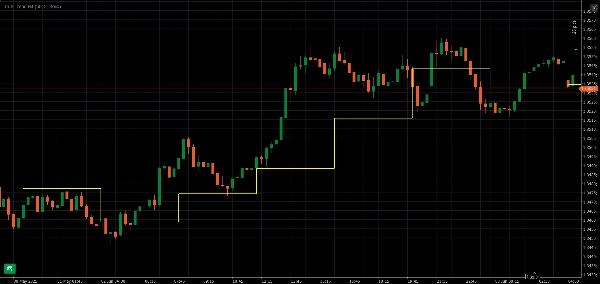
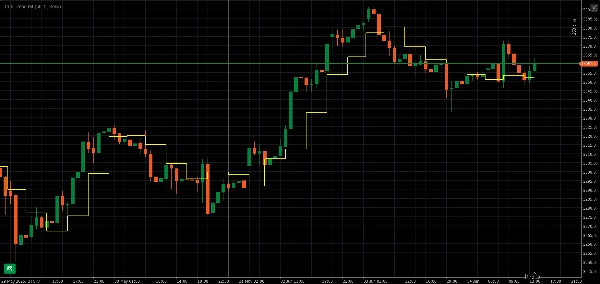
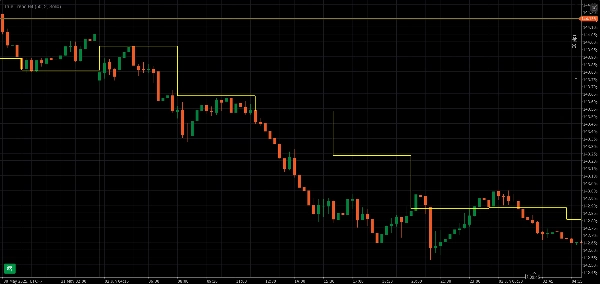
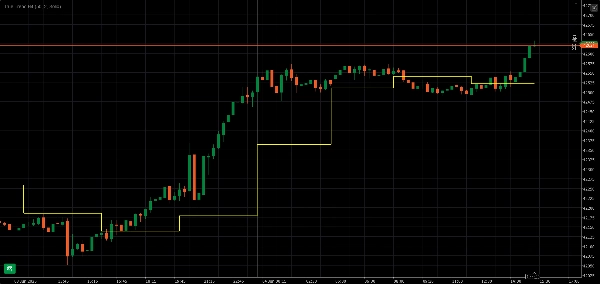
Der True Trend H4 Indikator verwendet eine Stufenlinie, um eine klare Richtung des H4-Trends zu vermitteln. Man kann sie sehr gut auf kleineren Zeitrahmen wie M1, M5, M15, M30 und H1 sehen.
Zusammenfassung
Indikatorprofil
Kundenbewertungen
4.0
Bewertungen: 1
5 | 0 % | |
4 | 100 % | |
3 | 0 % | |
2 | 0 % | |
1 | 0 % |
Kundenbewertungen
June 7, 2025
The signal still needs a chart check, no surprise there. A 5 minute check should not become a 30 minute rabbit hole.
Diskussion
Häufig gestellte Fragen (FAQ)
Über den cTrader Store verfügbare Produkte, einschließlich Handelsbots, Indikatoren und Plugins, werden von externen Entwicklern bereitgestellt und nur zu Informations- und technischen Zugriffszwecken verfügbar gemacht. cTrader Store ist kein Broker und erbringt keine Anlageberatung, persönlichen Empfehlungen oder eine Garantie für zukünftige Performance.


Preis
Seit 28/05/2025
69.61M
Gehandeltes Volumen
391.92K
Pip-Gewinn
2
Verkäufe