
Beschreibung
Der BLOCK LIQUIDITY Indikator kombiniert zwei Hauptansätze zur Marktanalyse:
Order Block Erkennung:
Identifiziert Unterstützungs- und Widerstandsbereiche basierend auf ungebrochenen Hochs und Tiefs innerhalb eines Rückblickzeitraums.
Erzeugt Kaufsignale, wenn der Preis über einem ungebrochenen Tief schließt.
Erzeugt Verkaufssignale, wenn der Preis unter einem ungebrochenen Hoch schließt.
Liquiditätsanalyse:
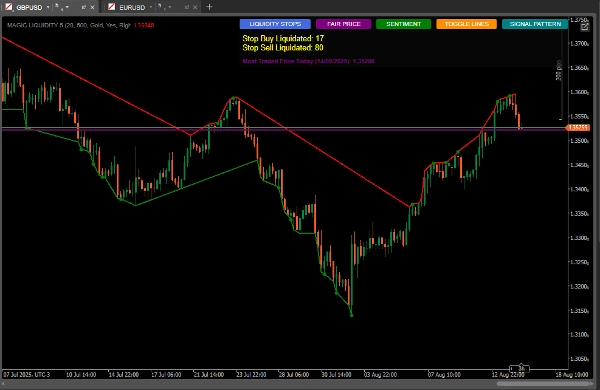
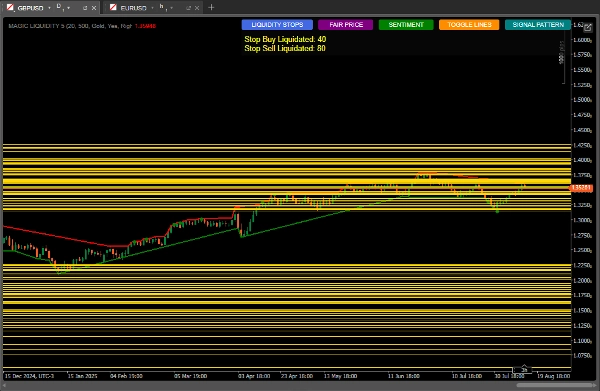
Erkennt Liquiditätspools (Bereiche, in denen Stop-Losses konzentriert sein können).
Überwacht die Aktivierung von Kauf- und Verkaufsstops.
Berechnet die Marktstimmung basierend auf der Liquiditätsverteilung.
Identifiziert den meistgehandelten Preis (Fairer Preis).
Wie man es für beste Ergebnisse verwendet
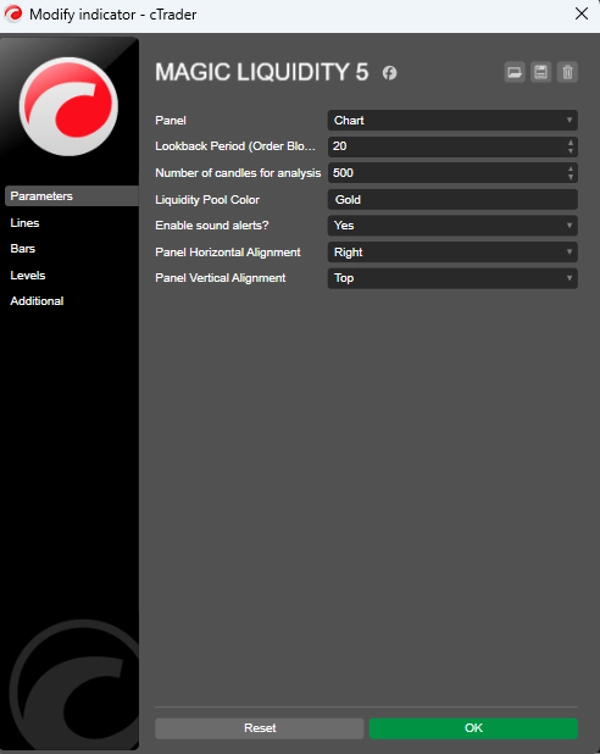
Erstkonfiguration
Rückblickzeitraum: Passen Sie den Parameter "Lookback Period" entsprechend dem Zeitrahmen an, in dem Sie handeln (höhere Werte für höhere Zeitrahmen).
Anzahl der Kerzen für die Analyse: Behalten Sie 500 für eine robuste Analyse bei oder reduzieren Sie sie für schnellere Reaktionen.
Farbe des Liquiditätspools: Wählen Sie eine Farbe, die auf Ihrem Chart hervorsteht.
Signalinterpretation
Order Block Signale:
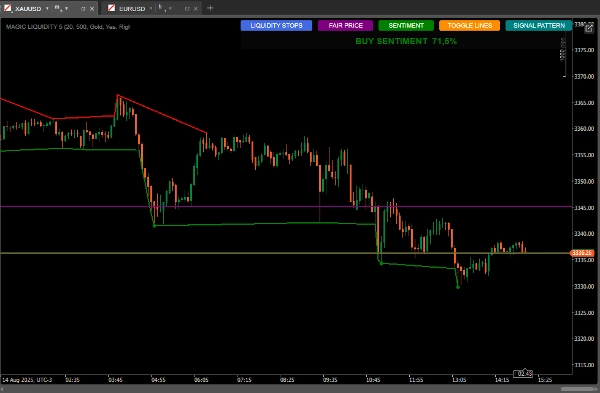
Grüne Punkte: Kaufsignale, wenn der Preis über einem ungebrochenen Tief schließt.
Rote Punkte: Verkaufssignale, wenn der Preis unter einem ungebrochenen Hoch schließt.
Liquiditätspools:
Horizontale Linien zeigen Liquiditätsbereiche (potenzielle Ziele oder Umkehrpunkte).
Überwachen Sie das Verhältnis der Liquidität oberhalb/unterhalb des aktuellen Preises.
Marktstimmung:
Verwenden Sie die Schaltfläche "SENTIMENT", um die vorherrschende Richtung und das Vertrauen zu sehen.
Kaufstimmung mit hohem Vertrauen deutet auf weiteres Wachstum hin. Verkaufstimmung mit hohem Vertrauen deutet auf eine bärische Fortsetzung hin.
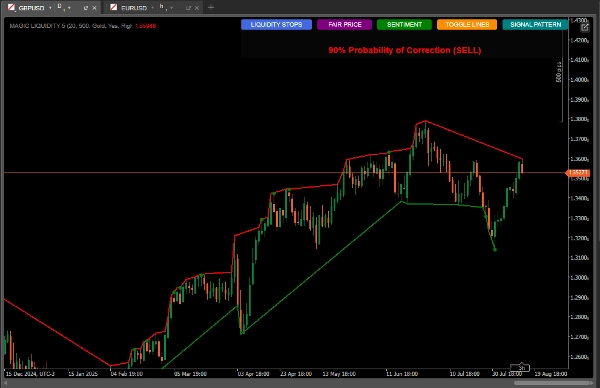
Kerzenmuster:
Die Schaltfläche "SIGNAL PATTERN" analysiert und
Zeigt Korrekturwahrscheinlichkeiten basierend auf dem quantitativen Verhältnis
Meistgehandelter Preis (Fairer Preis):
Die Schaltfläche "FAIR PRICE" zeigt das Preisniveau mit dem höchsten Volumen des Tages.
Es kann als Magnet für Preise oder als Unterstützung/Widerstand wirken.
Anwendungsstrategien
Konservative Strategie:
Handeln Sie nur, wenn Order Block Signale mit der vorherrschenden Stimmung übereinstimmen.
Verwenden Sie Liquiditätspools als Take-Profit-Ziele.
Aggressive Strategie:
Erwarten Sie Umkehrungen, wenn der Preis sich Liquiditätspools mit vielen angesammelten Stops nähert.
Nutzen Sie Divergenzen zwischen Stimmung und Kursverlauf für Gegen-Trend-Trades.
Zusätzliche Bestätigung:
Vergleichen Sie mit dem vom Indikator angezeigten Kerzenmuster.
Überprüfen Sie, ob der faire Preis in der Nähe als Interessensbereich liegt.
Risikomanagement.
Stop-Loss:
Platzieren Sie ihn unter dem letzten Order Block bei Käufen
Platzieren Sie ihn über dem letzten Order Block bei Verkäufen
Take-Profit:
Ziele in nahegelegenen Liquiditätspools
Berücksichtigen Sie das Liquiditätsverhältnis oberhalb/unterhalb, um Ziele festzulegen
Fortgeschrittene Tipps
Verwenden Sie die Schaltfläche "TOGGLE LINES", um Liquiditätslinien zu deaktivieren, wenn das Chart überladen ist
Überwachen Sie die Anzahl der liquidierten Stops, um die Stärke der Bewegung zu beurteilen
Der faire Preis ist besonders nützlich in Range-Märkten als dynamische Unterstützung/Widerstand
Kombinieren Sie ihn mit anderen Indikatoren zur Bestätigung (Volumen, gleitende Durchschnitte)
Indikatorvolumen:
https://ctrader.com/pt/products/635
Zusammenfassung
Users can customize parameters such as lookback period and number of candles analyzed to suit different timeframes and trading styles. Visual signals include green and red dots for buy and sell order block signals, and horizontal lines marking liquidity pools. Additional features include sentiment indication with confidence levels, candlestick pattern analysis for correction probabilities, and toggling of liquidity lines for chart clarity.
Recommended strategies include trading in the direction of order block signals aligned with sentiment for conservative approaches, or anticipating reversals near liquidity pools for aggressive trades. Risk management is supported by placing stop-loss orders relative to recent order blocks and setting take-profit targets at liquidity pools. The indicator can be combined with other tools like volume and moving averages for confirmation.
Kundenbewertungen
5 | 100 % | |
4 | 0 % | |
3 | 0 % | |
2 | 0 % | |
1 | 0 % |


