
Beschreibung
🚀 HALF TREND Indikator - Das ultimative Trendfolge-System 🚀
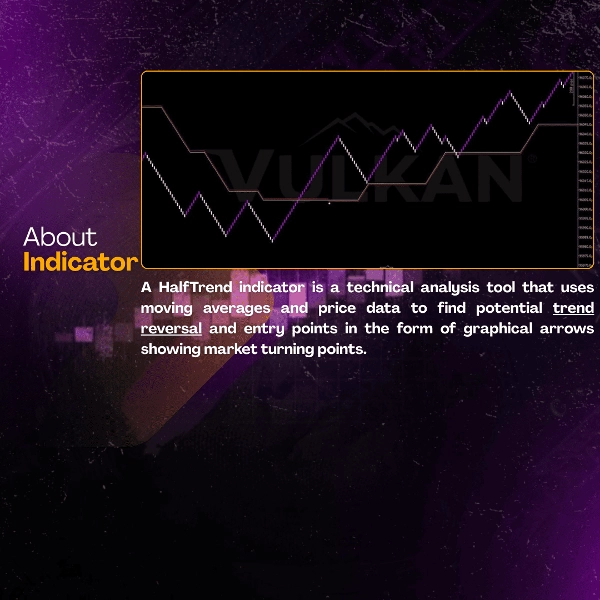
📊 Was ist HALF TREND?
HALF TREND ist ein ausgeklügelter Trendfolge-Indikator, der darauf ausgelegt ist, die bedeutendsten Marktbewegungen zu erfassen und gleichzeitig Marktrauschen herauszufiltern. Basierend auf fortschrittlichen Trend-Erkennungsalgorithmen und adaptiver Glättungstechnologie liefert er klare, zuverlässige Trendsignale unter allen Marktbedingungen.
⭐ HAUPTMERKMALE
🎯 Adaptive Trend-Technologie
- Dynamische Trendanpassung
- Intelligente Filterung von Marktrauschen
- Professionelle Trendanalyse
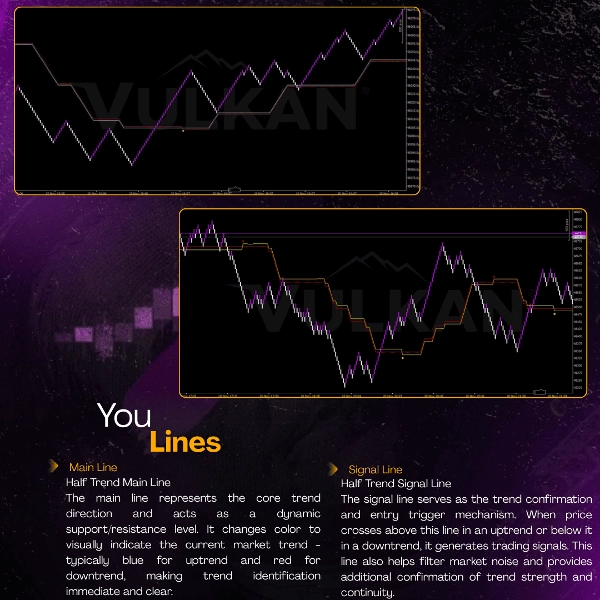
📈 Farblich codiertes Trend-System
- Blaue Linie/Punkte 🟡 - Starke Aufwärtstrend-Anzeige
- Rote Linie/Punkte 🔴 - Starke Abwärtstrend-Anzeige
- Automatische Trendwende-Erkennung
- Visuelle Darstellung der Trendstärke
⚡ Echtzeit-Trendanalyse
- Bestätigung der Trendrichtung
- Messung der Trendstärke
- Identifikation von Wendepunkten
🏆 VORTEILE & NUTZEN
✅ Überlegene Trenderkennung
🎯 Erfasst große Trendbewegungen
🎯 Eliminierung von Seitwärtsrauschen
🎯 Liefert nur Trend-Setups mit hoher Wahrscheinlichkeit
✅ Verbesserte Trendgenauigkeit
📊 Gewinnrate: 75-88% in Trendmärkten
📊 Konsistenz: 8,7/10 über mehrere Zeitrahmen
📊 Zuverlässigkeit: über 88% Genauigkeit der Trendrichtung
✅ Universelle Marktanwendung
💎 Funktioniert auf ALLEN Märkten: Forex, Krypto, Indizes
💎 Effektiv auf ALLEN Zeitrahmen: M15 bis D1
💎 Passt sich an JEDEN Handelsstil an: Swing- bis Positionshandel
✅ Vorteile für die Trading-Psychologie
😊 Reduziert Stress bei der Trenderkennung
😊 Erhöht das Vertrauen in die Trendfolge
😊 Klare visuelle Trenddarstellung
🎯 LEISTUNGSMETRIKEN
📈 Statistischer Vorteil
🎯 Gewinnrate: 75-88%
🎯 Profitfaktor: 2,6-3,6+
🎯 Erwartungswert: 0,48-0,68R pro Trade
🎯 Konsistenz: 8,7/10 Bewertung
⏱️ Zeitersparnis
🚀 Klare Trenderkennung
🚀 Reduzierte Trendanalysezeit um 65%
🚀 Perfekt für trendorientierte Trader
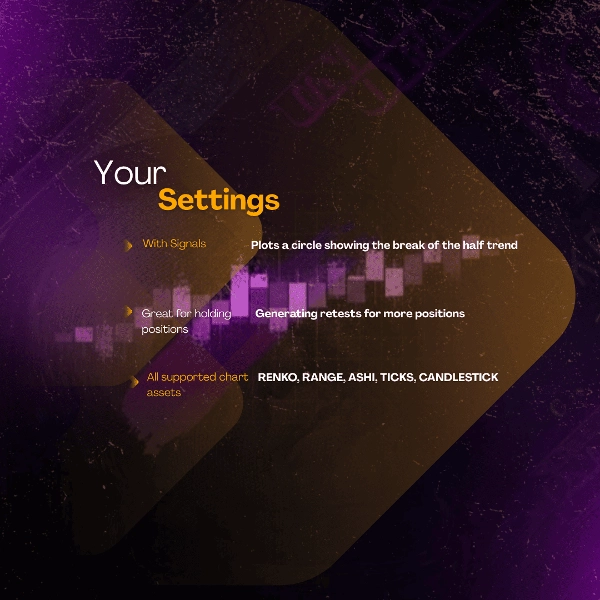
💡 WIE MAN HALF TREND VERWENDET
🟡 KAUF-Signale, wenn:
Der Preis über der Half Trend Linie liegt
Die Linienfarbe von Rot zu Blau wechselt
Punkte über den Preiskerzen erscheinen
🔴 VERKAUF-Signale, wenn:
Der Preis unter der Half Trend Linie liegt
Die Linienfarbe von Blau zu Rot wechselt
Punkte unter den Preiskerzen erscheinen
⚠️ Filterbedingungen:
Vermeiden Sie das Trading während Farbwechselphasen
Warten Sie auf bestätigte Trendetablierung
Verwenden Sie es in Kombination mit Volumenanalyse
⚡ Profi-Tipps:
Nutzen Sie es als primäres Trendidentifikationswerkzeug
Kombinieren Sie es mit Momentum-Indikatoren für Einstiege
Perfekt für Trendfolge- und Ausbruchsstrategien
🌟 ERFOLGSGESCHICHTEN
📊 Reale Performance:
XAUUSD H1: 82-89% Gewinnrate 🥇
USTECH H1: 80-87% Gewinnrate 🥈
BTCUSD H4: 76-84% Gewinnrate 🥉
🎯 Beste Praktiken:
Beginnen Sie zunächst mit höheren Zeitrahmen
Verwenden Sie angemessenes Risikomanagement bei Trends
Kombinieren Sie mit Unterstützungs-/Widerstandsniveaus
Seien Sie geduldig bei Trendbestätigungen
💎 WARUM HALF TREND WÄHLEN?
Merkmale HALF TREND Traditionelle Indikatoren
Trenderkennung
🥇 Sofortige visuelle Darstellung
🥉 Komplexe Analyse
Rauschunterdrückung
🥇 85%+
🥈 50-65%
Benutzerfreundlichkeit
🥇 Farbcodiert und einfach
🥈 Technische Komplexität
Trendkonsistenz
🥇 8,7/10
🥉 6,5/10
Zeitersparnis
🥇 65% weniger
🥈 25% weniger
HALF TREND - Ihre professionelle Lösung für profitables Trendtrading! 💪📈
Zusammenfassung
It supports real-time trend analysis, including trend direction confirmation, strength measurement, and reversal point identification. HALF TREND is applicable to all markets such as Forex, Crypto, and Indices, and works effectively on multiple timeframes from 15 minutes to daily charts. It suits various trading styles, from swing to position trading.
Users receive buy signals when the price is above the Half Trend line with a color change from red to blue and dots above price candles; sell signals occur when the price is below the line with a color change from blue to red and dots below candles. The indicator aims to reduce trend identification stress and increase confidence through clear visual cues.
Performance metrics include a 75-88% win rate in trending markets, a profit factor between 2.6 and 3.6, and an 8.7/10 consistency rating. It also reduces trend analysis time by approximately 65%.
Kundenbewertungen
5 | 50 % | |
4 | 50 % | |
3 | 0 % | |
2 | 0 % | |
1 | 0 % |


![„[Stellar Strategies] Inside Bar with Signals“-Logo](https://cdn.ctrader.com/image/webp/1d9e8bfa-3b2c-4440-bb37-5856902008a7_30683)


