
VegaXLR - Auto Support and Resistance
Indicador
6 compras
Versão 1.0, Feb 2025
Windows, Mac
4.3
Avaliações: 3
Descrição
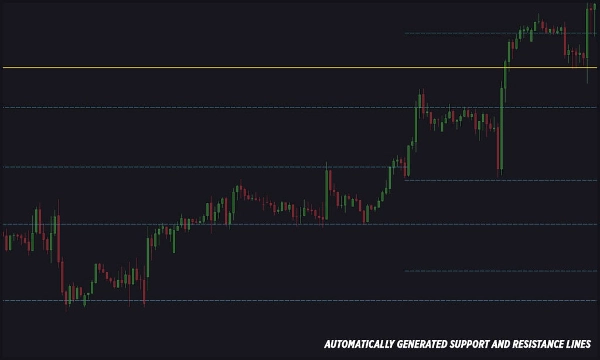
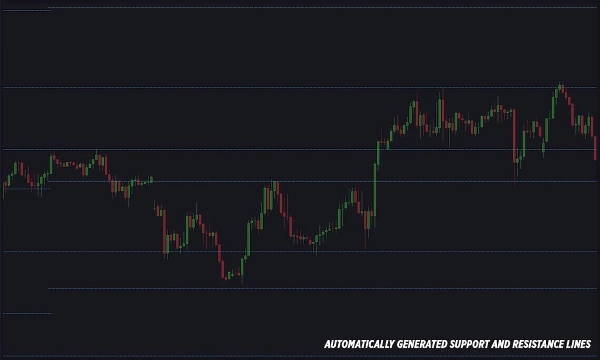
Este indicador cTrader desenha automaticamente linhas de suporte e resistência no seu gráfico, facilitando o uso tanto para iniciantes quanto para profissionais. As linhas são geradas com base em níveis-chave de Fibonacci e oscilações de preço (zigzags).
Características:
- Detecta e desenha automaticamente linhas de suporte e resistência.
- Estilos, espessuras e cores das linhas totalmente personalizáveis.
- Número ajustável de linhas de suporte e resistência.
- Alertas quando o preço interage com as linhas de suporte ou resistência.
- Múltiplas opções de alerta: Telegram, Email, Pop-ups e sons.
- Capacidade de escolher quais níveis de Fibonacci geram as linhas.
- Opção para disparar alertas a partir das linhas de preço Ask ou Bid.
- Condições configuráveis de alerta: alertas no fechamento da barra ou alertas instantâneos ao toque do preço.
- Mensagens de alerta personalizáveis com comentários definidos pelo usuário.
- Opção para ativar alertas apenas para níveis fortes de suporte e resistência.
- Capacidade de capturar e enviar capturas de tela do gráfico via Telegram (o gráfico deve estar visível).
- Configuração simples de alertas por email.
- Acesso rápido ao guia do usuário através de um pequeno botão no gráfico.
Resumo
Resumo de IA
VegaXLR - Auto Support and Resistance is a cTrader indicator that automatically identifies and draws support and resistance lines on trading charts. It uses key Fibonacci levels combined with price swing analysis (zigzags) to generate these lines, aiding traders in recognizing critical price levels. The indicator offers full customization of line styles, thickness, and colors, and allows adjustment of the number of support and resistance lines displayed.
It features real-time alerts triggered when price interacts with these levels, with configurable conditions such as bar-close or instant price-touch alerts. Alert notifications can be sent via multiple channels including Telegram, Email, pop-ups, and sounds. Users can specify which Fibonacci levels to use for line generation and choose whether alerts trigger from Ask or Bid price lines. Additional options include enabling alerts only for strong levels, customizing alert messages, and capturing chart screenshots to send via Telegram.
A user guide is accessible directly from the chart for ease of use. This tool supports Forex markets and is designed to assist both beginners and professionals in technical analysis by automating the detection of key support and resistance zones.
Perfil do indicador
Avaliações de clientes
4.3
Avaliações: 3
5 | 67 % | |
4 | 0 % | |
3 | 33 % | |
2 | 0 % | |
1 | 0 % |
Avaliações de clientes
March 2, 2025
Focused trade layer if the trader wants it keeps attention on levels that actually matter. It works best as support, not a final decision maker. The cleanest use is 3 to 5 levels per chart, with 0.5 pullbacks checked before entry. not every zone holds, even if it looks clean.
March 1, 2025
March 1, 2025
Balanced demo helper for traders who build plans around market levels. It gives value around key price zones, but not every zone holds, even if it looks clean. I would wait for 2 reactions and avoid trades where the target is less than 1.5R. Levels are useful when they reduce noise, not when they crowd the chart.
Conversa
Perguntas frequentes
Forex
Os produtos disponíveis através da cTrader Store, incluindo bots de negociação, indicadores e plugins, são fornecidos por programadores terceiros e são disponibilizados apenas para fins informativos e de acesso técnico. A cTrader Store não é um corretor e não fornece aconselhamento em matéria de investimento, recomendações pessoais ou qualquer garantia de desempenho no futuro.


![Logótipo de "[Hamster-Coder] Moving Average MTF"](https://cdn.ctrader.com/image/webp/b11b98b1-194d-4b8e-b00e-d611826ad159_31226)


Preço
231
Vendas
694
Instalações gratuitas