
Descrição
📈 Este indicador é uma ferramenta que nos ajuda a identificar e visualizar a direção da tendência em um gráfico de preços. 📊 Seu funcionamento baseia-se no cálculo dos níveis de tendência usando médias móveis exponenciais e uma medida de volatilidade para determinar as zonas onde o preço deve se mover. A seguir, explicarei em detalhes como funciona:
📐 Cálculo dos Níveis de Tendência
O indicador começa calculando o que é chamado de "nível base". Este nível é obtido pela média de duas médias móveis exponenciais: uma de curto prazo (baseada em um comprimento definido pelo usuário, neste caso, 222) e uma de longo prazo (o dobro do comprimento da primeira). Essas médias nos dão uma referência para a tendência geral.
Em seguida, a volatilidade é calculada usando o desvio padrão dos preços de fechamento, e esse valor é suavizado com uma média móvel exponencial adicional. A volatilidade suavizada é multiplicada por um parâmetro chamado "sensibilidade", que nos fornece os níveis superior e inferior ao redor do nível base. Esses níveis atuam como bandas de tendência e ajudam a identificar se o preço está acima ou abaixo da tendência.
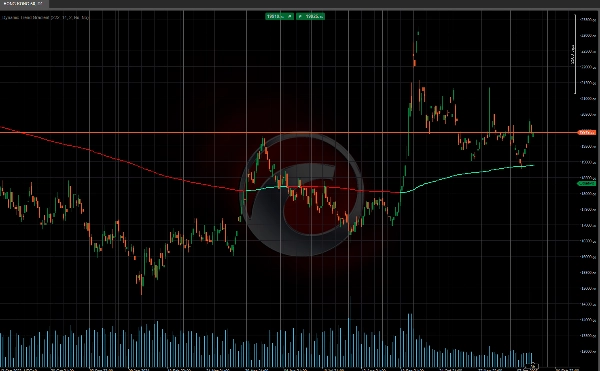
📉📈 Status da Tendência
Com esses níveis calculados, o indicador avalia o status da tendência no mercado. Se o preço estiver acima do nível base, assume uma tendência de alta 🐂, e se estiver abaixo, a tendência é de baixa 🐻. Se o preço cruzar os níveis superior ou inferior, o indicador muda seu sinal de tendência, indicando uma possível reversão ou mudança no momento do mercado.
Esta ferramenta é perfeita para traders que desejam estar à frente das tendências do mercado! 🚀📉📈
Indicadores da Ctrader Store:
Dynamic Market Structure
Analysis of Turning Points
Fibonacci Linear
Regression Multi-timeframe
Multi-Level Candle Bias
Tracker
Auto Support and
Resistance Trend Lines
Resumo
Avaliações de clientes
5 | 0 % | |
4 | 100 % | |
3 | 0 % | |
2 | 0 % | |
1 | 0 % |


