
الوصف
مؤشرات متجر Pinescriptlabs: روبوتات متجر Pinescriptlabs : (cBot) اختراق الذهب و BTCنقاط محورية الجلسة(جديد)
هيكل السوق المتقدم: Bos, Choch, SwinLevels, كتل الأوامر، مكتشف هيكل السوق والسيولة (جديد)
خوارزمية ذكية متتبعة (جديد)
دعم SmartTrend و
المقاومة
الخطوط
تحليل
هيكل السوق
الديناميكي
لنقاط
الانعطاف
النقاط
انحدار
خطّي
فيبوناتشي
متعدد الأطر الزمنية
متعدد المستويات
انحياز الشمعة
المتعقب
جميع
مستويات الدعم
والمقاومة
المستويات
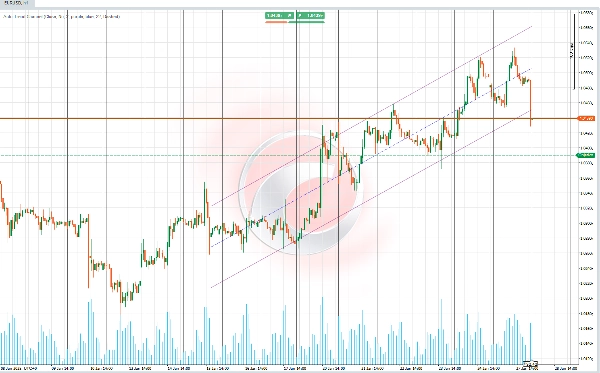
📊 قناة الاتجاه التلقائية 📊
يعرض هذا المؤشر قناة اتجاه بناءً على حساب الانحدار الخطي والانحراف المعياري لبيانات السعر (لوغاريتمي) لفترة يتم اختيارها تلقائيًا. 📈 يتم تحديد الفترة باستخدام معامل ارتباط بيرسون (RRR)، مع اختيار الأعلى قيمة مطلقة. 🧮
✨ الوظائف الرئيسية ✨
الوظيفة الأساسية هي حساب قناة اتجاه تتكيف تلقائيًا مع طول الفترة الأكثر تمثيلاً، باستخدام إحصائيات متقدمة لتحديد الدعم، المقاومة، و خط الاتجاه المركزي.
تشمل القناة:
1️⃣ خط الأساس الذي يمثل الاتجاه الخطي المحسوب.
2️⃣ الخطوط العليا والسفلى التي تحدد نطاقات القناة على مسافة تتناسب مع الانحراف المعياري.
🚀 الميزات والحسابات 🚀
🔎 حساب الفترة المثلى
- يقيم المؤشر فترات بيانات متعددة (قصيرة أو طويلة، حسب الإعداد) للعثور على الفترة التي تتمتع بأدق ارتباط بسلوك السوق.
- يُستخدم معامل ارتباط بيرسون كمقياس رئيسي لتحديد الفترة التي تمتلك أقوى علاقة بين السعر التاريخي وخط الاتجاه المولد.
📐 الانحدار الخطي وتوقع السعر
- لكل فترة مقيمة، يتم حساب خط انحدار بناءً على اللوغاريتم الطبيعي للأسعار لتثبيت التغيرات القصوى.
- تشمل المكونات الرئيسية للحساب:
-
- الميل: يمثل معدل تغير السعر.
- المقطع: نقطة البداية للخط المتوقع.
- المتوسط: يحدد خط أساس مرجعي.
📊 الانحراف المعياري وحدود القناة
- يتم حساب الانحراف المعياري للأسعار بالنسبة لخط الانحدار.
- يتم اشتقاق النطاق العلوي (المقاومة) و النطاق السفلي (الدعم) عن طريق تعديل الخط المركزي بواسطة مضاعف الانحراف المعياري القابل للتكوين من قبل المستخدم.
🌈 تصوير قناة الاتجاه
- تتكون القناة من ثلاثة عناصر رئيسية:
-
- الخط المركزي: يعرض الاتجاه الرئيسي بناءً على خط الانحدار.
- الخط العلوي: يمثل الحد العلوي للقناة (المقاومة)، معدل بالانحراف المعياري.
- الخط السفلي: يمثل الحد السفلي للقناة (الدعم)، معدل بالانحراف المعياري.
- يمكن للمستخدمين تخصيص الألوان، الشفافية، وأنماط الخطوط لتحسين الوضوح البصري.
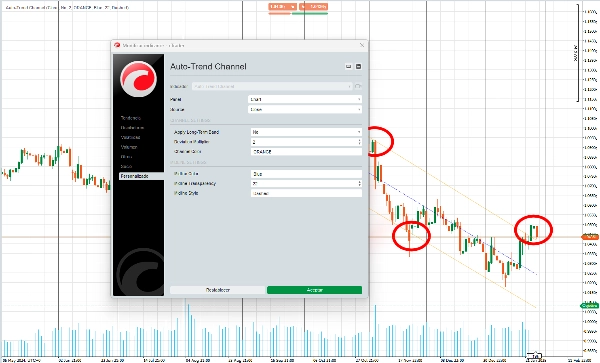
🎛️ القدرة على التكيف والتكوين
- يمكن للمستخدمين تخصيص جوانب مختلفة من المؤشر، مثل:
-
- ألوان الخطوط والقناة.
- ما إذا كان التركيز على الفترات الطويلة (الاتجاهات الكبرى) أو الفترات القصيرة (الاتجاهات الصغرى).
- يضمن هذا التكيف ملاءمة المؤشر لأنماط تداول مختلفة وتفضيلات بصرية متنوعة.
🔍 الاستخدام :
1️⃣ تحديد الاتجاه
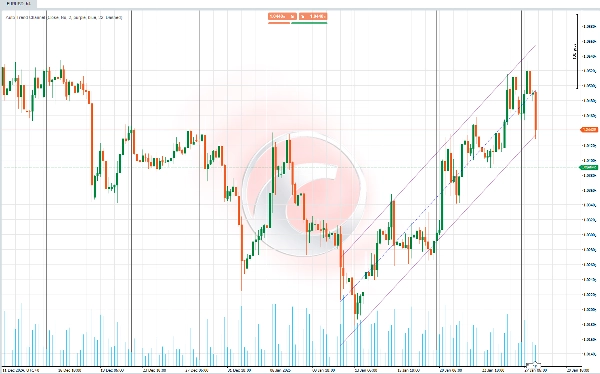
- يساعد الخط المركزي للقناة في تحديد ما إذا كان السوق في اتجاه صاعد، اتجاه هابط، أو اتجاه جانبي.
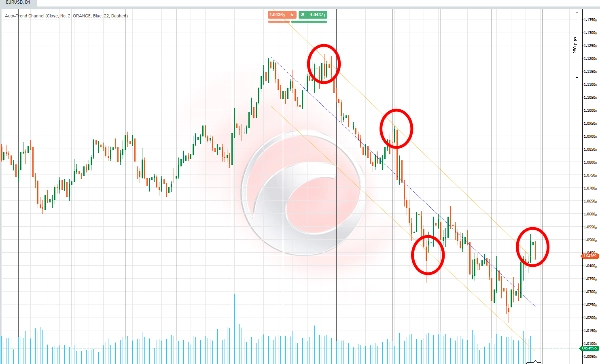
2️⃣ الدعم والمقاومة الديناميكية
- تعمل خطوط القناة العليا والسفلى كمناطق محتملة حيث قد ينعكس السعر أو يتماسك.
3️⃣ كشف التماسك والاختراق
- تشير الأسعار التي تبقى ضمن القناة إلى تماسك، بينما يشير الاختراق إلى تغير في الاتجاه أو حركة سعرية قوية.
4️⃣ التكيف مع أنماط التداول المختلفة
- الفترات الطويلة مفيدة لتحديد الاتجاهات العامة واتخاذ قرارات استراتيجية في أطر زمنية أوسع.
- الفترات القصيرة تسمح للمتداولين بالتقاط حركات أسرع والاستجابة للتغيرات الفورية في السوق.
الملخص
Key features include:
- Optimal period selection by evaluating multiple data intervals to find the strongest correlation between historical prices and the trend line.
- Calculation of slope, intercept, and mean for precise linear regression and price projection.
- Visualization of the trend channel with customizable colors, transparency, and line styles.
- Adaptability for different trading styles by allowing focus on long-term (macro) or short-term (micro) trends.
Use cases:
- Identifying market trends (uptrend, downtrend, sideways) via the central trend line.
- Detecting dynamic support and resistance zones where price may reverse or consolidate.
- Recognizing consolidation phases within the channel and breakouts signaling trend changes or strong price movements.
- Adjusting analysis to suit strategic decisions or faster market responses depending on selected period length.
This indicator supports various markets including cryptocurrencies (BTCUSD), commodities (XAUUSD), and others, providing a statistical approach to trend and channel analysis.
تقييمات العملاء
5 | 60 % | |
4 | 20 % | |
3 | 20 % | |
2 | 0 % | |
1 | 0 % |


![شعار "[Stellar Strategies] MARSI Signal Plotter"](https://cdn.ctrader.com/image/webp/7b2b8da6-8f8e-4646-8d4a-4710c516c01e_25567)


