
Reactive Moving Average
مؤشر
260 التنزيلات
الإصدار 1.0، Jan 2025
Windows, Mac
5.0
التقييمات: 1
الوصف
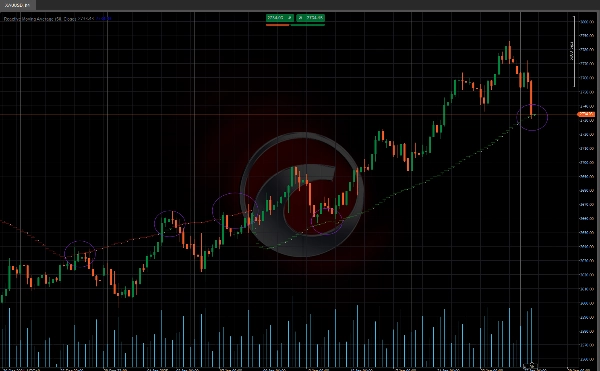
📈 المتوسط المتحرك للإشارة 📉
المتوسط المتحرك للإشارة هو مؤشر يجمع بين المتوسط المتحرك البسيط (SMA) مع حساب ارتباط ديناميكي للتكيف بشكل أفضل مع ظروف السوق. 🎯 يقوم هذا المؤشر بضبط حساسيته بناءً على قوة الاتجاه، مما يجعله أداة قوية لتحديد الاتجاهات وتصفيتها من ضوضاء السوق. 🌟
الميزات الرئيسية 🔑
📊 المتوسط المتحرك المعدل:
- خط المتوسط المتحرك يتكيف ديناميكيًا بناءً على الارتباط بين السعر والوقت.
- في الأسواق ذات الاتجاه القوي، يتحرك المتوسط المتحرك بسرعة أكبر لمتابعة السعر. 🚀
- في الأسواق الجانبية، يظل المتوسط المتحرك أكثر استقرارًا، مما يقلل من الإشارات الخاطئة. 🛑
🔢 حساب الارتباط:
- يقوم المؤشر بحساب الارتباط بين السعر والوقت باستخدام صيغة بيرسون.
- يضبط المتوسط المتحرك بناءً على معامل التحديد (R²). 🧮
👀 التصور:
- عرض واضح وبديهي لتفسير سهل. 📉📈
كيفية استخدام المؤشر 🛠️
🔍 تحديد الاتجاه:
- اتجاه صاعد: عندما يكون السعر فوق المتوسط المتحرك المرتبط. 🐂
- اتجاه هابط: عندما يكون السعر تحت المتوسط المتحرك المرتبط. 🐻
✅ تأكيد الإشارة:
- استخدم المتوسط المتحرك المعدل كمستوى دعم أو مقاومة ديناميكي. 🛡️
- ادمج هذا المؤشر مع أدوات فنية أخرى لتأكيد الإشارات. 🔄
تعديل المتوسط المتحرك ⚙️
يقوم الخوارزم بضبط المتوسط المتحرك بناءً على قيمة R²:
- إذا كانت R² > 0.5 (ارتباط مهم):
-
- يتم تعديل المتوسط المتحرك باستخدام مزيج موزون بين قيمة SMA الحالية والقيمة السابقة للمتوسط المتحرك المعدل (_ma).
- تعتمد الأوزان على قيمة R². ⚖️
- إذا كانت R² ≤ 0.5 (ارتباط غير مهم):
-
- يتم تعديل المتوسط المتحرك بطرح قيمة تتناسب مع الفرق المطلق بين قيمة SMA الحالية والقيمة السابقة للمتوسط المتحرك المعدل. 🔄
- مؤشرات متجر Ctrader:
هيكل السوق الديناميكي
تحليل نقاط التحول
فيبوناتشي الخطي
انحدار متعدد الأطر الزمنية
تحيز الشمعة متعدد المستويات
المتعقب
الملخص
ملف تعريف المؤشر
تقييمات العملاء
5.0
التقييمات: 1
5 | 100 % | |
4 | 0 % | |
3 | 0 % | |
2 | 0 % | |
1 | 0 % |
تقييمات العملاء
August 12, 2025
Pros: Adaptive moving average combining SMA with dynamic correlation to reduce lag and smooth price noise. Flexible sensitivity settings. Cons: No alerts or tooltips. No template saving. Can produce noise on low-end PCs or very short timeframes.
مناقشة
الأسئلة الشائعة
Signal
Breakout
Supertrend
RSI
يتم توفير المنتجات المتاحة من خلال cTrader Store، بما في ذلك روبوتات التداول والمؤشرات والإضافات، من قبل مطوري الطرف الثالث وإتاحتها لأغراض الوصول المعلوماتي والفني فقط. cTrader Store ليس وسيطًا ولا يقدم نصائح استثمارية أو توصيات شخصية أو أي ضمان للأداء المستقبلي.


السعر
منذ 03/10/2024
163
المبيعات
37.73K
التثبيتات المجانية