Description
Sachez exactement quand les principaux marchés ouvrent et ferment. FX Market Sessions affiche les quatre principales sessions de trading avec leurs niveaux hauts et bas, vous aidant à synchroniser vos entrées autour des heures les plus volatiles de la journée.
Caractéristiques principales
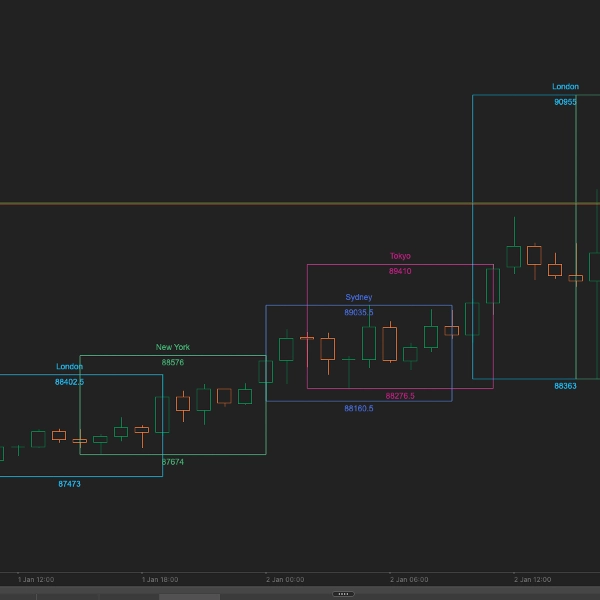
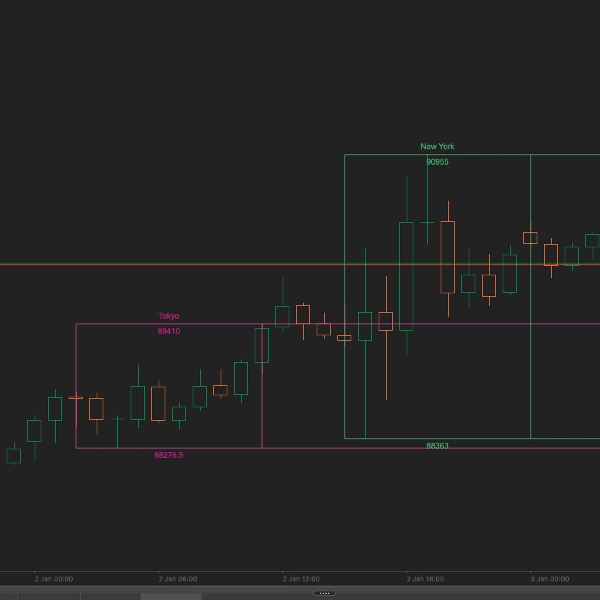
- Quatre sessions majeures : sessions de Sydney, Tokyo, Londres et New York affichées avec des heures de début/fin personnalisables et un ajustement automatique de l'heure d'été
- Niveaux hauts/bas des sessions : suit et affiche automatiquement les niveaux hauts et bas de chaque session avec des lignes extensibles pour la planification du support/résistance
- Affichage en direct des sessions : le panneau d'information en temps réel montre quelles sessions sont actuellement ouvertes - plus besoin de deviner quand Londres ou New York commence
- Contexte historique : visualisez jusqu'à 10 jours des niveaux des sessions passées pour voir comment le prix a réagi aux limites clés des sessions
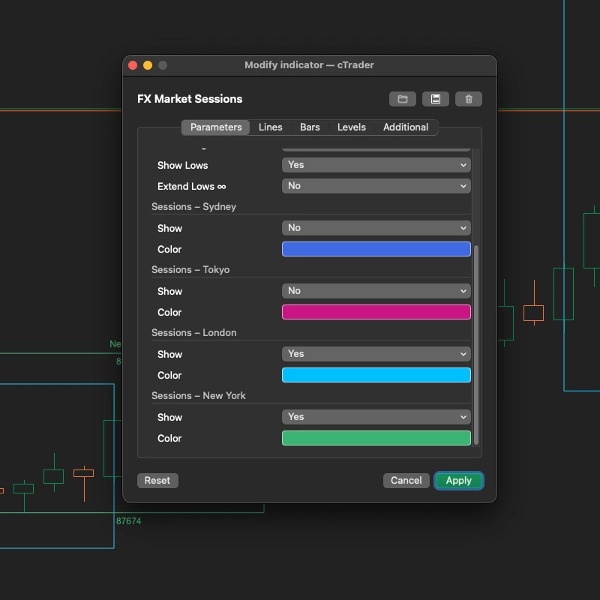
- Personnalisation complète : choisissez quelles sessions afficher, sélectionnez des couleurs personnalisées et décidez si vous souhaitez étendre les niveaux hauts/bas indéfiniment
Comment ça fonctionne
L'indicateur calcule automatiquement les quatre principales sessions de trading forex basées sur leurs fuseaux horaires locaux respectifs :
- Sydney : 21:00-06:00 AEST (ajusté pour l'heure d'été)
- Tokyo : 00:00-09:00 JST
- Londres : 08:00-17:00 GMT (ajusté pour l'heure d'été)
- New York : 13:00-22:00 EST (ajusté pour l'heure d'été)
Chaque session est dessinée comme une zone verticale avec ses niveaux hauts et bas marqués. Le panneau d'information dans le coin supérieur droit affiche en temps réel quelles sessions sont actuellement ouvertes.
Paramètres
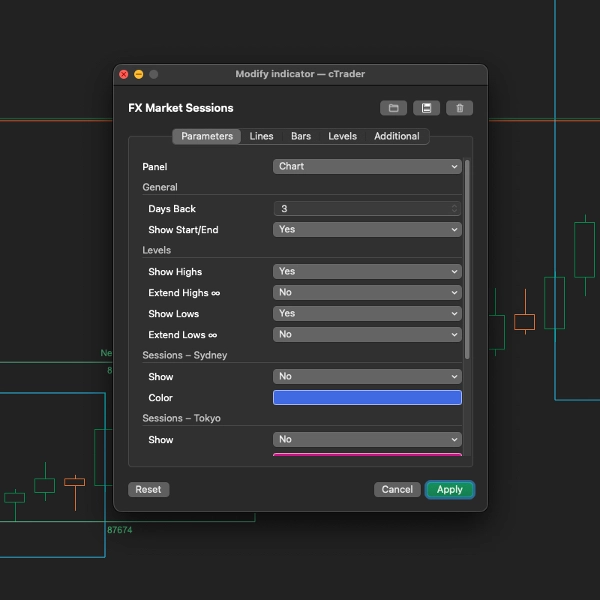
Paramètres généraux
- Jours en arrière (Par défaut : 3) : Nombre de jours historiques pour afficher les boîtes de session (0-10)
- Afficher début/fin (Par défaut : Vrai) : Dessiner des lignes verticales aux heures d'ouverture et de fermeture des sessions
Paramètres des niveaux
- Afficher les hauts (Par défaut : Vrai) : Afficher le niveau haut de chaque session
- Étendre les hauts (Par défaut : Faux) : Étendre les lignes hautes jusqu'au bord droit du graphique
- Afficher les bas (Par défaut : Vrai) : Afficher le niveau bas de chaque session
- Étendre les bas (Par défaut : Faux) : Étendre les lignes basses jusqu'au bord droit du graphique
Paramètres des sessions (Sydney, Tokyo, Londres, New York)
- Afficher : Activer ou désactiver les sessions individuelles
- Couleur : Couleur personnalisée pour les éléments d'affichage de chaque session
Idéal pour
- Les day traders qui ont besoin de savoir quand la volatilité augmente
- Les traders de breakout qui tradent les ouvertures de session
- Les traders utilisant les niveaux hauts/bas des sessions comme support/résistance
- Toute personne souhaitant visualiser les meilleures heures de trading
Conseils de trading
- Ouverture de Londres : L'une des périodes les plus volatiles - définit souvent la direction de la journée
- Chevauchement Londres/New York : 13:00-16:00 GMT a généralement le volume et la volatilité les plus élevés
- Session asiatique : Idéale pour trader les paires JPY et AUD
- Breakouts de session : Le prix franchissant le haut/bas d'une session peut signaler des mouvements de continuation
Périodes prises en charge
Fonctionne de manière optimale sur des périodes de M5 à H4. L'indicateur ajuste automatiquement les boîtes de session pour s'adapter à l'échelle de votre graphique.
Résumé
Key features include automatic plotting of session high and low price levels, with options to extend these levels across the chart for support and resistance analysis. A live info panel shows which sessions are currently open in real-time. Users can customize which sessions to display, adjust colors, and set how many past days (up to 10) of session data to show, excluding weekends.
The indicator is optimized for intraday timeframes, working best on 5-minute to 4-hour charts. It provides historical context by showing previous session levels, aiding traders in timing entries around periods of increased volatility such as the London open and the London/New York overlap. This tool supports trading strategies that rely on session timing and price levels for breakout and intraday trading decisions.
Avis clients
5 | 100 % | |
4 | 0 % | |
3 | 0 % | |
2 | 0 % | |
1 | 0 % |