
Rsi + Volume
Indicateur
707 téléchargements
Version 1.0, Mar 2025
Windows, Mac
5.0
Avis : 3
Depuis le 21/02/2025
466.3M
Volume tradé
180.83K
Pips gagnés
22
Ventes
6.92K
Installations gratuites
Description
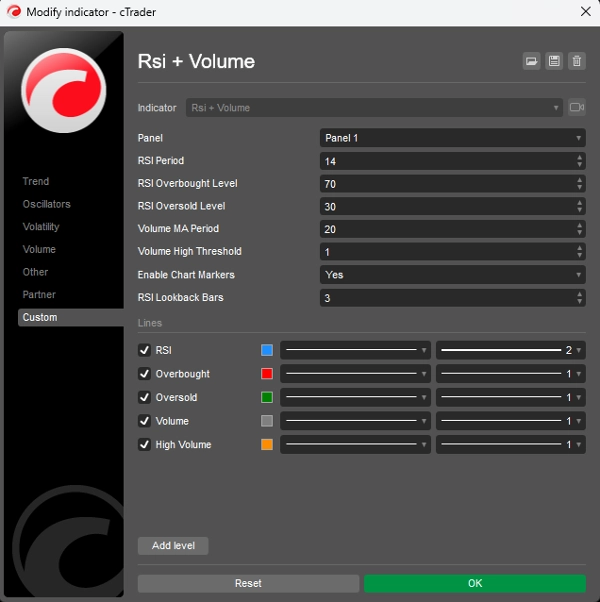
Cet indicateur combine le RSI (Relative Strength Index) avec l'analyse du volume pour générer des signaux de trading plus fiables. Il fonctionne sur le principe que des mouvements de prix significatifs doivent être accompagnés d'un volume élevé pour confirmer la force du mouvement.
Composants clés :
- Analyse du RSI :
-
- Mesure la vitesse et le changement des mouvements de prix sur une échelle de 0 à 100
- Identifie les conditions de surachat (au-dessus de 70) et de survente (en dessous de 30)
- Aide à repérer les points potentiels de retournement sur le marché
- Analyse du volume :
-
- Compare le volume actuel à une moyenne mobile du volume récent
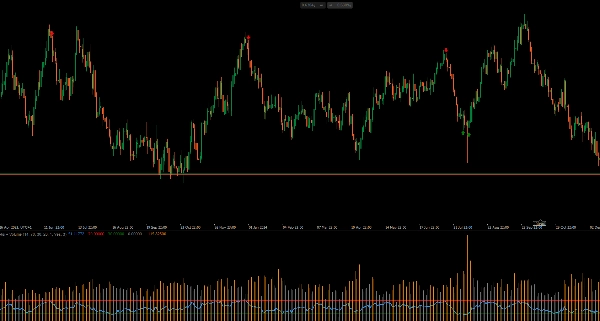
- Met en évidence les périodes de volume élevé (barres d'histogramme orange)
- Confirme la force derrière les mouvements de prix
- Génération de signaux :
-
- Signal d'achat : lorsque le RSI croise au-dessus du niveau de survente (30) avec un volume élevé
- Signal de vente : lorsque le RSI croise en dessous du niveau de surachat (70) avec un volume élevé
- Les signaux visuels apparaissent directement sur le graphique (flèches vertes vers le haut pour l'achat, flèches rouges vers le bas pour la vente)
Comment l'utiliser :
- Recherchez des signaux d'achat lorsque le prix est en tendance baissière et que le RSI indique des conditions de survente
- Recherchez des signaux de vente lorsque le prix est en tendance haussière et que le RSI indique des conditions de surachat
- Un volume plus élevé confirme la force du signal
- Ajustez les paramètres (période du RSI, seuil de volume) pour correspondre à votre horizon de trading
Cet indicateur aide à filtrer les faux signaux en exigeant à la fois une confirmation du RSI et un volume supérieur à la moyenne, ce qui le rend plus fiable que l'utilisation du RSI seul.
Résumé
Résumé IA
The "Rsi + Volume" indicator integrates the Relative Strength Index (RSI) with volume analysis to enhance the reliability of trading signals. It operates on the principle that significant price movements should be confirmed by high trading volume.
Key components include:
1. RSI Analysis:
- Measures the speed and change of price movements on a 0-100 scale.
- Identifies overbought conditions (above 70) and oversold conditions (below 30).
- Helps detect potential market reversal points.
2. Volume Analysis:
- Compares current volume against a moving average of recent volume.
- Highlights periods of high volume using orange histogram bars.
- Confirms the strength behind price movements.
Signal generation occurs when RSI crosses key thresholds with accompanying high volume:
- Buy signals trigger when RSI rises above the oversold level (30) with high volume.
- Sell signals trigger when RSI falls below the overbought level (70) with high volume.
Visual signals appear directly on the chart as green up arrows for buys and red down arrows for sells.
Users can adjust parameters such as RSI period and volume threshold to fit their trading timeframe. This indicator aims to filter out false signals by requiring both RSI confirmation and above-average volume, providing more dependable trade signals than RSI alone.
Profil de l'indicateur
Avis clients
5.0
Avis : 3
5 | 100 % | |
4 | 0 % | |
3 | 0 % | |
2 | 0 % | |
1 | 0 % |
Avis clients
October 12, 2025
Hello, the RSI +volume indicator is perfect, but it needed to have something: when the little arrow appears on the chart, it could show a notification or an alarm. Would you be able to add that alarm or notification in cTrader?
August 12, 2025
Pros: Combines RSI and volume for stronger trading signals. Works well when RSI threshold intersects with high volume spikes. Lightweight and clear visuals. Cons: No alerts or tooltips. Lacks template saving. May generate noise on low-volume timeframes without additional filters.
Discussion
Questions fréquentes
Signal
Indices
RSI
Les produits disponibles sur cTrader Store, notamment les bots de trading, les indicateurs et les plug-ins, sont fournis par des développeurs tiers et mis à disposition à titre informatif et à des fins d'accès technique uniquement. cTrader Store n'est pas un courtier et ne fournit aucun conseil en investissement, aucune recommandation personnelle ni aucune garantie quant aux performances futures.


Prix
Depuis le 21/02/2025
466.3M
Volume tradé
180.83K
Pips gagnés
22
Ventes
6.92K
Installations gratuites