Deskripsi
Indikator Teori Kuartalan (ICT) — Zona Sesi & Sinyal Pintar
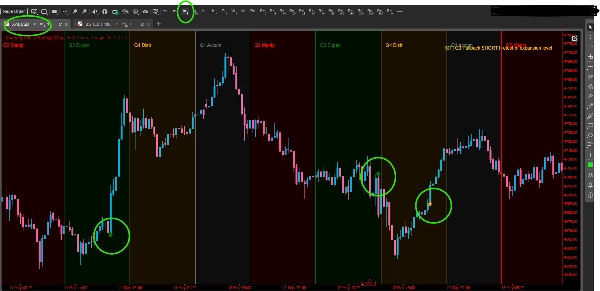
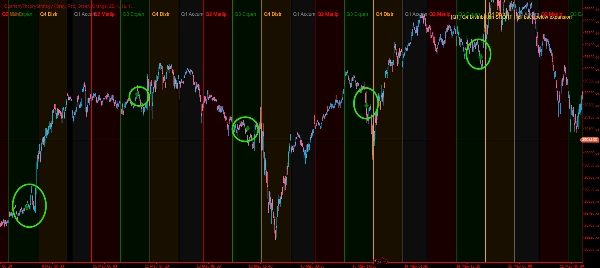
The Indikator Teori Kuartalan menghadirkan kerangka siklus sesi ICT (Inner Circle Trader) langsung ke grafik cTrader Anda. Berdasarkan konsep bahwa setiap hari perdagangan 24 jam dibagi menjadi empat fase berbeda selama 6 jam, indikator ini secara otomatis mengidentifikasi dan memvisualisasikan:
- Q1 – Akumulasi (18:00–00:00 NY): Posisi uang pintar secara diam-diam
- Q2 – Manipulasi (00:00–06:00 NY): Gerakan palsu & perburuan stop
- Q3 – Ekspansi (06:00–12:00 NY): Gerakan arah yang sebenarnya
- Q4 – Distribusi (12:00–18:00 NY): Pengambilan keuntungan & pembalikan
Fitur Utama
Latar Belakang Zona Sesi Setiap kuartal diberi bayangan dengan latar belakang warna yang sepenuhnya dapat disesuaikan dan diberi label langsung pada grafik. Warna, opasitas, dan ketebalan batas semuanya dapat diatur. Zona diperbarui secara dinamis saat menggulir dan memperbesar.
4 Sinyal Masuk Pintar
- Perburuan Stop Q2 — mendeteksi sapuan harga tertinggi/terendah Q1 yang ditutup kembali di dalam, menandakan pembalikan jebakan
- Masuk Ekspansi Q3 — aktif saat harga menembus rentang Q2, menandai gerakan arah yang sebenarnya
- Masuk Tarik Kembali Q3 — mengidentifikasi pengujian ulang level breakout ekspansi untuk entri risiko lebih rendah
- Distribusi Q4 — memberi peringatan saat harga melintasi kembali level ekspansi selama fase distribusi
Setiap sinyal digambar sebagai panah arah (↑↓) langsung pada bar grafik tempat kondisi terpenuhi.
Peringatan Bawaan Saat berjalan pada bar langsung, indikator memutar suara dan menampilkan pesan di layar untuk setiap sinyal yang aktif — tidak perlu pengawasan manual.
Kontrol Kinerja Parameter Days to Show yang dapat dikonfigurasi (1–60 hari) membatasi seberapa jauh zona dan sinyal digambar, menjaga penggunaan RAM tetap rendah bahkan pada timeframe frekuensi tinggi.
Penyesuaian Sesi NY Mendukung offset EST (UTC−5) dan EDT (UTC−4), memastikan batas zona yang akurat terlepas dari waktu server broker Anda.
Ringkasan
The indicator provides four smart entry signals directly on the chart as directional arrows: Q2 Stop-Hunt (detects false breakouts within Q1 highs/lows), Q3 Expansion Entry (signals breakout from Q2 range), Q3 Pullback Entry (identifies retests of breakout levels), and Q4 Distribution (alerts on price crossing back through expansion levels). These signals include real-time alerts with sound and on-screen messages when conditions occur on live bars.
Additional features include a configurable "Days to Show" parameter to limit historical data display for performance optimization and support for both EST and EDT time offsets to align session zones accurately with New York time. The indicator is tagged with market structure concepts such as Fair Value Gap, Break of Structure, and Liquidity Sweep, and outputs visualizations, signals, and filters based on bar data.
Ulasan pelanggan
5 | 0 % | |
4 | 100 % | |
3 | 0 % | |
2 | 0 % | |
1 | 0 % |





















![Logo "[Stellar Strategies] BOS Trend 1.0"](https://cdn.ctrader.com/image/webp/6cdec0f1-0e97-4a82-a8a4-2b67aed54d38_25695)