
Açıklama
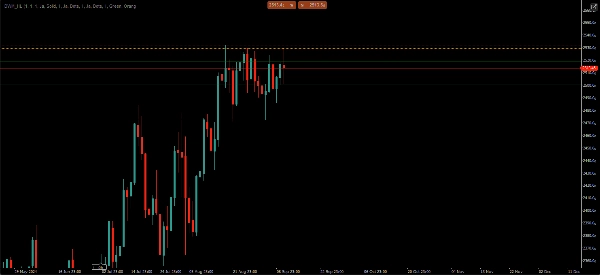
NGS Likidite Seviyeleri – Günlük • Haftalık • Aylık Yüksekler & Düşükler
Rastgele çizgiler etrafında değil, likidite etrafında işlem yapın.
NGS Likidite Seviyeleri, her grafikte en önemli Günlük, Haftalık ve Aylık likidite seviyelerini otomatik olarak gösterir.
• Manuel çizim yok
• Zaman dilimi değiştirme yok
• Grafik karmaşası yok
Bu kullanıcı dostu gösterge, traderların saniyeler içinde ana likidite ve piyasa yapısı seviyelerini tanımlamasına yardımcı olur. Her gün yüksek ve düşükleri manuel olarak işaretlemek yerine, en önemli seviyeler sizin için otomatik olarak gösterilir ve güncellenir.
Özellikler:
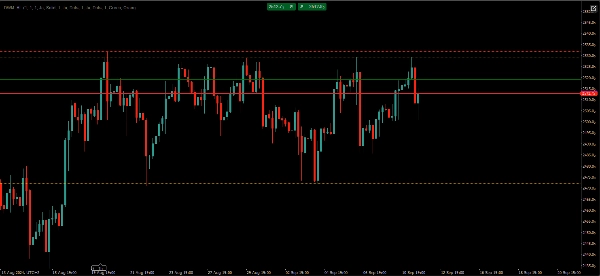
• Otomatik Günlük Yüksek & Düşük seviyeler
• Otomatik Haftalık Yüksek & Düşük seviyeler
• Otomatik Aylık Yüksek & Düşük seviyeler
• İsteğe bağlı önceki dönem seviyeleri
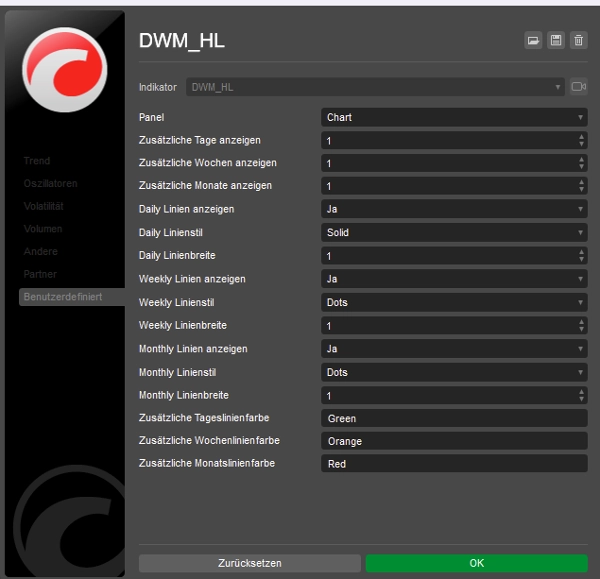
• Özelleştirilebilir renkler ve çizgi stilleri
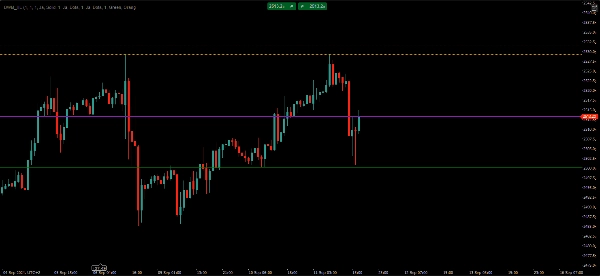
• Temiz ve hafif grafik görüntüleme
• Forex, Endeksler, Emtialar ve Kripto para üzerinde çalışır
• Çoklu zaman dilimlerini destekler
• Yeniden boyamayan
Piyasa yapısı, likidite ve daha yüksek zaman dilimi seviyelerine odaklanan traderlar için tasarlanmıştır.
Sinyal yok.
Strateji yok.
Kâr garantisi yok.
Sadece nesnel likidite seviyeleri ve daha temiz bir işlem akışı.
Özet
Müşteri değerlendirmeleri
5 | 100 % | |
4 | 0 % | |
3 | 0 % | |
2 | 0 % | |
1 | 0 % |


