
FVG_tidypips
Indicateur
13 achats
Version 1.0, Nov 2024
Windows, Mac
4.3
Avis : 3

Description
Cet indicateur Fair Value Gap (FVG) est un outil d'analyse technique qui aide les traders à identifier les déséquilibres de prix.
Caractéristiques :
- Basculer la visibilité des gaps haussiers et/ou baissiers
- Affiche des boîtes codées par couleur pour une visualisation facile (par défaut : vert pour haussier, rouge pour baissier, or pour les niveaux intermédiaires)
- Période de retour ajustable pour réduire l'encombrement du graphique
- Paramètre d'extension de boîte configurable (décalage) pour une meilleure visualisation
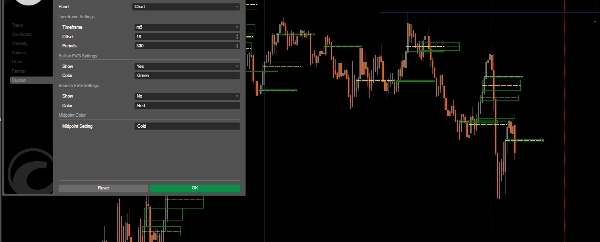
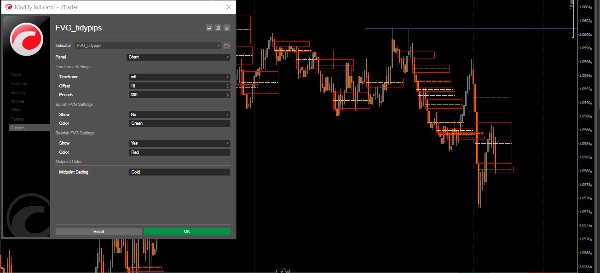
Paramètres :
- Période : Sélectionnez votre période préférée pour afficher les FVG
- Décalage : Ajustez l'extension horizontale des boîtes FVG (3-500)
- Périodes : Définissez la période de retour pour le calcul historique des FVG
- Afficher les FVG haussiers/baissiers
- Couleurs : Personnalisez les couleurs pour les FVG haussiers, baissiers et les lignes intermédiaires
Applications de trading :
- Support et Résistance : Les FVG agissent souvent comme des niveaux forts de support/résistance
- Aimants de prix : Les gaps non comblés ont tendance à attirer l'action des prix (DOL)
- Structure du marché : Aide à identifier les zones potentielles de retournement et les points d'intérêt de continuation
- Analyse des blocs d'ordres : Repérez les zones de trading institutionnel
Meilleures pratiques d'application :
- Utilisez-le en conjonction avec d'autres outils d'analyse technique.
- Les périodes plus longues produisent des FVG plus significatifs, les périodes plus courtes sont utilisées avec un biais directionnel de période plus longue
- Surveillez la réaction du prix lors du retour dans les zones FVG
- Faites attention à la ligne médiane car elle sert souvent d'aimant à prix
Découvrez d'autres indicateurs utiles que j'ai publiés. Si vous trouvez celui-ci — ou l'un de mes autres indicateurs — utile, envisagez de soutenir mon travail en achetant ou en faisant un don. Votre soutien m'aide non seulement à continuer de développer et d'améliorer ces outils, mais il garantit également que je peux continuer à créer de nouveaux indicateurs précieux pour améliorer votre expérience de trading. Merci pour votre soutien continu !
https://buymeacoffee.com/tidypips
Résumé
Résumé IA
The FVG_tidypips indicator is a technical analysis tool designed to identify Fair Value Gaps (FVGs), which represent price imbalances on trading charts. It visually highlights bullish and bearish gaps using color-coded boxes—green for bullish, red for bearish, and gold for midpoint levels—facilitating quick recognition of potential support and resistance zones. Users can toggle the visibility of bullish and/or bearish gaps, adjust the lookback period to manage chart clutter, and configure the horizontal extension (offset) of the FVG boxes for clearer visualization.
Key parameters include selecting the timeframe for FVG display, setting the offset range (3–500), defining the lookback period for historical gap calculation, and customizing colors for different gap types and midpoint lines. The indicator supports trading applications such as identifying strong support/resistance levels, spotting price magnets where unfilled gaps attract price action, analyzing market structure for potential reversal or continuation zones, and detecting institutional order block areas.
Best practices recommend using this indicator alongside other technical tools, focusing on higher timeframes for more significant FVGs, and monitoring price reactions when revisiting FVG zones. The midpoint line is noted as an important price magnet. This tool is applicable across various markets, including commodities like gold (XAUUSD).
Profil de l'indicateur
Avis clients
4.3
Avis : 3
5 | 33 % | |
4 | 67 % | |
3 | 0 % | |
2 | 0 % | |
1 | 0 % |
Avis clients
November 22, 2024
Good idea with limits for traders who use ICT or SMC concepts. It gives value around smart money style analysis, but zones still need manual validation. A good sample is 20 FVG or order block reactions, with messy 0.705 areas skipped. The zone is more convincing when structure and risk both make sense.
November 21, 2024
November 21, 2024
Small but practical edge for smart money style analysis. it adds structure around liquidity, gaps and market shifts, especially when used for mapping zones before entries. For SMC logic, I trust zones more when 0.5 mitigation, BOS and liquidity sweep line up. The zone is more convincing when structure and risk both make sense.
Discussion
Questions fréquentes
Commodities
XAUUSD
Les produits disponibles sur cTrader Store, notamment les bots de trading, les indicateurs et les plug-ins, sont fournis par des développeurs tiers et mis à disposition à titre informatif et à des fins d'accès technique uniquement. cTrader Store n'est pas un courtier et ne fournit aucun conseil en investissement, aucune recommandation personnelle ni aucune garantie quant aux performances futures.
Plus de cet auteur


Prix
15
Ventes
4.61K
Installations gratuites