
Drawing Utility
Indicateur
208 téléchargements
Version 1.0, Jul 2025
Windows, Mac
Description
Alt + Glisser pour l'activer sur vos graphiques.
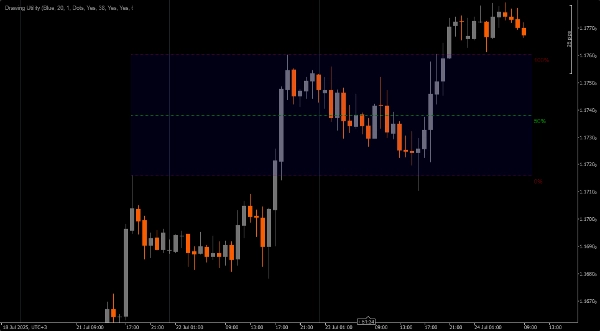
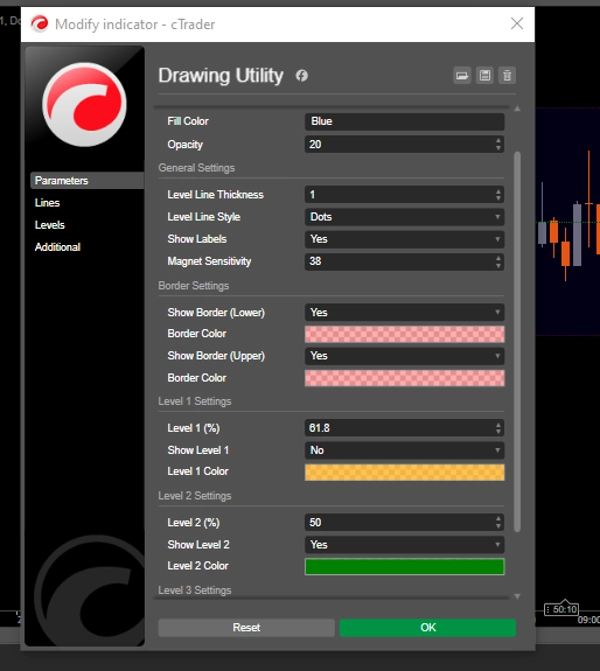
Outil de dessin personnalisable.
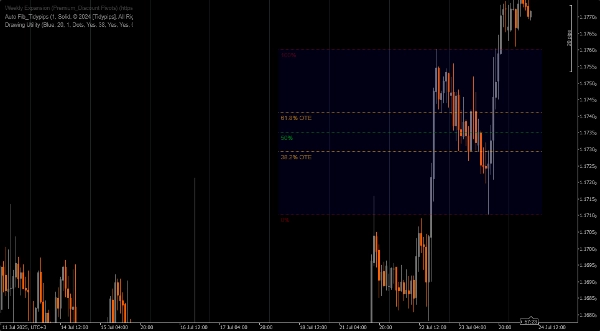
1. Accès rapide à Fibonacci.
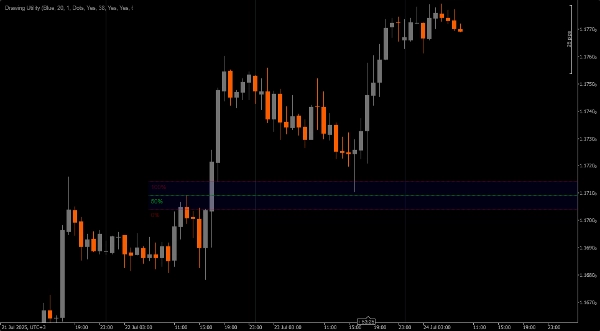
2. Marqueur de Fair Value Gap
3. Outil de mesure
4. Marqueur de Point d'Intérêt
5. ou toute autre utilisation (à laquelle je n'ai pas pensé) que vous pourriez trouver appropriée pour annoter vos graphiques
NOTE **Alt + Glisser pour l'activer sur vos graphiques.**
Résumé
Résumé IA
Drawing Utility is a customizable chart annotation tool designed for trading platforms. It features a rectangular box with five adjustable Fibonacci levels, which can also be customized to user-defined values. The utility is activated by pressing Alt and dragging on the chart. Key functionalities include quick access to Fibonacci retracement levels, marking Fair Value Gaps, measuring price movements, and highlighting Points of Interest. Additionally, it supports flexible use cases for various chart annotations, allowing traders to tailor it to their specific analysis needs.
Profil de l'indicateur
Avis clients
0.0
Avis : 0
Avis clients
Il n'y a pas encore d'avis sur ce produit. Vous l'avez déjà essayé ? Soyez le premier à en parler aux autres !
Discussion
Questions fréquentes
Les produits disponibles sur cTrader Store, notamment les bots de trading, les indicateurs et les plug-ins, sont fournis par des développeurs tiers et mis à disposition à titre informatif et à des fins d'accès technique uniquement. cTrader Store n'est pas un courtier et ne fournit aucun conseil en investissement, aucune recommandation personnelle ni aucune garantie quant aux performances futures.
Plus de cet auteur


![Logo de "[Stellar Strategies] Inside Bar with Signals"](https://cdn.ctrader.com/image/webp/1d9e8bfa-3b2c-4440-bb37-5856902008a7_30683)


Prix
15
Ventes
4.61K
Installations gratuites