
Mô tả
Nó cho phép người dùng đánh dấu thời gian mở và đóng cửa của các phiên giao dịch chính—Châu Á, London, New York và London Close—với màu sắc, kiểu dáng và độ dày có thể tùy chỉnh. Chỉ báo này vẽ các đường xu hướng cao và thấp cho mỗi phiên, cung cấp cái nhìn sâu sắc về hành vi thị trường. Với chức năng kéo và thả thân thiện với người dùng (+ phím Alt), nó giúp việc vẽ các mức cao và thấp của phiên trở nên nhanh chóng. Hoàn hảo cho cả nhà giao dịch mới và có kinh nghiệm, chỉ báo này giúp việc điều hướng các phức tạp của các phiên thị trường khác nhau trở nên dễ dàng hơn.
Tính năng
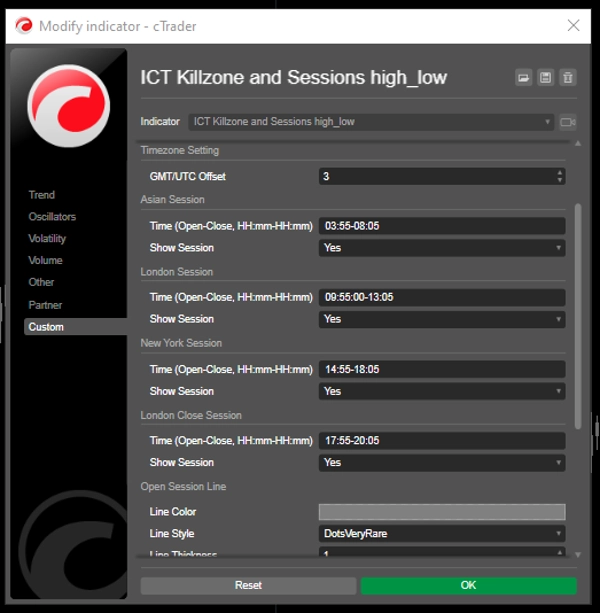
Thời gian phiên có thể tùy chỉnh: Người dùng có thể định nghĩa thời gian mở và đóng cửa cho các phiên giao dịch chính (Châu Á, London, New York và London Close), cho phép hiển thị tùy chỉnh phù hợp với chiến lược giao dịch của họ.
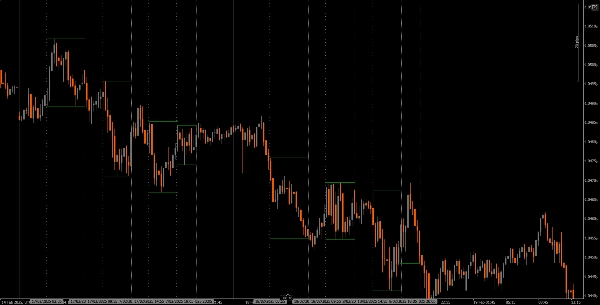
Đường thẳng đứng động: Chỉ báo vẽ các đường thẳng đứng tại thời điểm mở và đóng cửa phiên, giúp dễ dàng nhận biết các sự kiện thị trường quan trọng ngay lập tức.
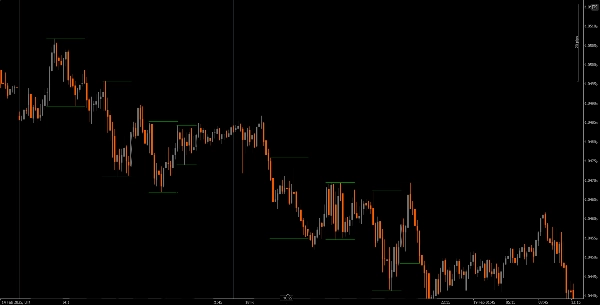
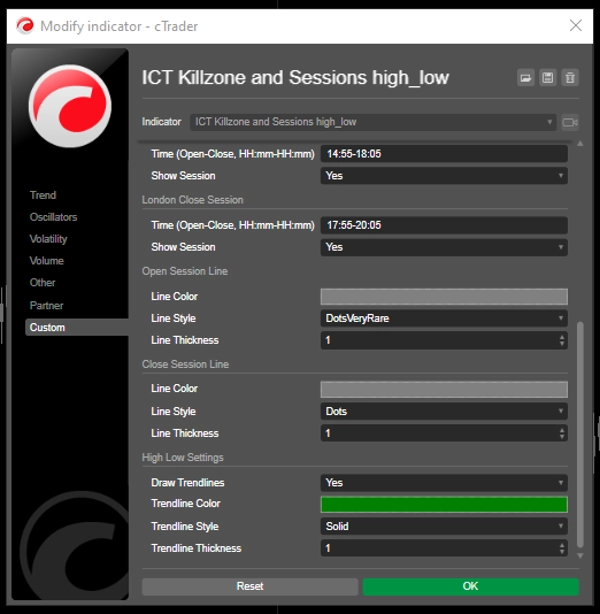
Hiển thị đường xu hướng: Nó có thể tự động vẽ các đường xu hướng cao và thấp cho mỗi phiên, cho phép nhà giao dịch nhìn thấy các mức hỗ trợ và kháng cự tiềm năng dựa trên hành động giá của phiên.
Kéo và thả thân thiện với người dùng (+ phím Alt): Chức năng kéo và thả (+ phím Alt) cho phép nhà giao dịch dễ dàng chọn phạm vi thời gian cụ thể để phân tích, nâng cao trải nghiệm người dùng tổng thể.
Nhãn phiên: Tùy chọn hiển thị nhãn bên cạnh các đường xu hướng của phiên giúp rõ ràng hơn, hỗ trợ nhà giao dịch nhanh chóng nhận biết phiên họ đang phân tích.
Điều chỉnh múi giờ: Người dùng có thể đặt bù GMT/UTC, đảm bảo thời gian phiên được hiển thị chính xác theo múi giờ địa phương của họ.
Hướng dẫn
Cài đặt: Tải xuống và cài đặt chỉ báo The ICT Killzone and Sessions high_low trên nền tảng cAlgo của bạn.
Thiết lập: Mở cài đặt để tùy chỉnh thời gian phiên, màu sắc, kiểu đường và độ dày theo sở thích của bạn.
Sử dụng chỉ báo: Nhấp và kéo (+ phím Alt) trên biểu đồ để tạo một hình chữ nhật bao quanh phạm vi thời gian bạn muốn phân tích. Chỉ báo sẽ tự động vẽ các đường thẳng đứng và đường xu hướng cho các phiên đã chỉ định.
Phân tích: Quan sát các đường phiên và đường xu hướng khi bạn giao dịch. Sử dụng thông tin này để xác định các mức hỗ trợ và kháng cự tiềm năng dựa trên động lực của phiên.
Công cụ hỗ trợ được khuyến nghị
cTrader: Nền tảng gốc cho cAlgo, cung cấp trải nghiệm liền mạch khi sử dụng và tùy chỉnh các chỉ báo.
Công cụ phân tích thị trường: Kết hợp chỉ báo này với các công cụ phân tích thị trường, như trung bình động hoặc bộ dao động, để nâng cao chiến lược giao dịch của bạn.
Công cụ quản lý rủi ro: Sử dụng máy tính kích thước vị thế và công cụ dừng lỗ để quản lý rủi ro hiệu quả khi giao dịch.
Bằng cách tích hợp chỉ báo The ICT Killzone and Sessions high_low với các công cụ này, nhà giao dịch có thể cải thiện phân tích thị trường và tăng cơ hội thành công khi điều hướng các phức tạp của các phiên giao dịch khác nhau.
Tóm tắt
A drag-and-drop (+Alt Key) feature allows quick selection of specific time ranges for analysis. Optional session labels clarify which session is being viewed. Timezone adjustments via GMT/UTC offset ensure session times align with the trader’s local time zone.
Designed for use on the cAlgo platform, this tool supports enhanced market analysis when combined with other market analysis and risk management tools. It assists traders in navigating the complexities of different market sessions by providing clear visual cues and trendline insights.
Đánh giá của khách hàng
5 | 40 % | |
4 | 20 % | |
3 | 0 % | |
2 | 0 % | |
1 | 40 % |


![Logo "[CB] Pivot Points Pro"](https://cdn.ctrader.com/image/webp/43463c82-67b0-4f10-a4ba-901bba091d81_32594)


