
▁▂▃▄▅▆▇ █ 10,000+ nhà giao dịch (tổ chức + bán lẻ) █ ▇▆▅▄▃▂▁
- Chọn các chỉ báo HÀNG ĐẦU của chúng tôi trên cTrader 🏆
- ✨ Độ chính xác độc quyền cho kết quả vượt trội ✨
- 📈 Thuật toán của chúng tôi — với hình ảnh được đánh giá cao nhất 🎯—
- đã được triển khai thành công trong 2 quỹ định lượng
▁▂▃▄▅▆▇ █████████████████████████████ ▇▆▅▄▃▂▁
_______________________________________________
_______________________________________________
📌 Chỉ báo Cấu trúc Thị trường
· ✅ AdvancedMarket Structure: Bos, Choch, SwinLevels, Order Blocks, Market Structure& Liquidity Finder
· 🔄 Dynamic Market StructureAnalysis of Turning Points
· 🧱 Order Block
· ⚖️ Market Imbalance
· ⛓️ BOS & CHOCH
· 🧠 ICT Power of 3
______________________________________________________________-
Kho cBots : 🧠 Gold & BTC BreakoutSession Pivots 🧠
_______________________________________________
🔚 Hệ thống Thoát Thông minh
· 📍 Thuật toán Thông minh Theo sau
_______________________________________________
📐 Chỉ báo ZigZag
· 🔍 Dự báo Thanh khoản Giá ZigZag
· ➖ ZigZag
· 🎯 Bộ theo dõi Cực đoan Zig-Zag
_______________________________________________
🧱 Chỉ báo Hỗ trợ & Kháng cự
· 🟩 Đường Hỗ trợ & Kháng cự SmartTrend
· 🧱 Tất cả các Mức Hỗ trợ và Kháng cự
_______________________________________________
📊 Chỉ báo Xu hướng & Kênh
· 📊 Supertrend
· ⚡Bộ phân tích Xu hướng Động lực
· ⭐ KÊNH SSL CAO CẤP
_______________________________________________
💧 Công cụ Khối lượng & Thanh khoản
· 🔥 Bản đồ Nhiệt POC Khối lượng
· 🔍 Khoảng cách Giá trị Công bằng Động lực
· 🕒 Phiên Khoảng cách Giá trị Công bằng
_______________________________________________
⚡ Chỉ báo Động lực & RSI
· 🔎 Bộ theo dõi Định hướng Nến Đa cấp
_______________________________________________
🔮 Công cụ Dự đoán & Dự báo
· 📐 Dự đoán dựa trên Linreg& ATR
· 📏 Hồi quy Tuyến tính Fibonacci Đa khung thời gian
· 📈 Máy chiếu Dòng chảy Thị trường dựa trên Khối lượng
______________________________________________________________________________________________________
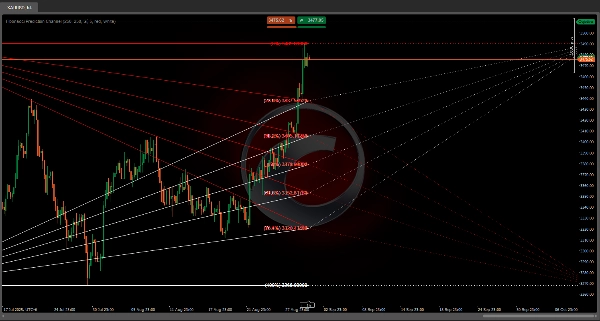
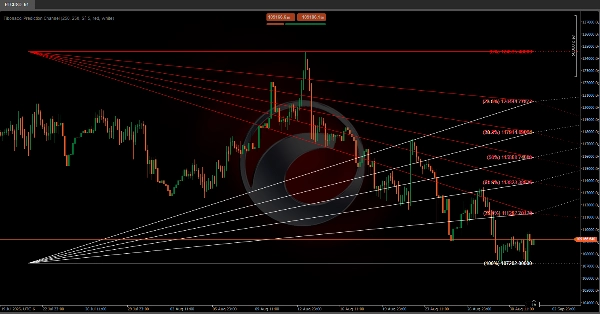
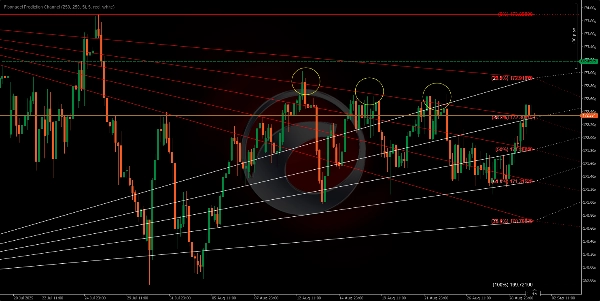
Thuật toán này được thiết kế để vẽ một kênh dự đoán tương lai dựa trên Fibonacci các mức thoái lui 📊✨. Các đường Fibonacci tạo ra một chuỗi các kênh song song giữa mỗi cặp mức liên tiếp. Các kênh này có thể được hiểu như các phạm vi mà giá dự kiến sẽ dao động 📈📉, tạo ra một hình nón trực quan nơi giá sẽ tương tác 🎯. Nếu một mức bị phá vỡ ⚡, chúng ta sẽ chuyển sang mức tiếp theo.
Những mức này, mà chúng ta chiếu vào tương lai, cũng đóng vai trò như hỗ trợ và kháng cự 🛡️⚔️, tạo ra các kênh trực quan trên biểu đồ giúp chúng ta dự đoán và lên kế hoạch hành động 🧠✅ dựa trên cách giá đã phản ứng với các mức này trong quá khứ.
Chúng ta có thể mong đợi giá phản ứng khi tiếp cận các đường này 🔍, có thể nảy lại trong kênh 🔄 hoặc, nếu có đủ động lực 🚀, phá vỡ các đường để chuyển sang kênh tiếp theo.
Các mức được chiếu sang bên phải ➡️🗓️ không dựa trên dữ liệu giá mới mà dựa trên hành động giá trong quá khứ ⏳. Chúng mở rộng vào tương lai như một loại "bản đồ" 🗺️ cho các phản ứng giá tiềm năng trong tương lai.
Thanh lịch sử ⏰: Xác định số lượng khoảng thời gian giá trong quá khứ sẽ được xem xét khi tính toán các mức thoái lui Fibonacci.


