
Mô tả
Chỉ báo CHIẾN LƯỢC KHỐI PHÉP THUẬT kết hợp hai phương pháp chính để phân tích thị trường:
Phát hiện Khối Lệnh:
Xác định các vùng hỗ trợ và kháng cự dựa trên các đỉnh và đáy chưa bị phá vỡ trong một khoảng thời gian nhìn lại.
Tạo tín hiệu mua khi giá đóng cửa trên một đáy chưa bị phá vỡ.
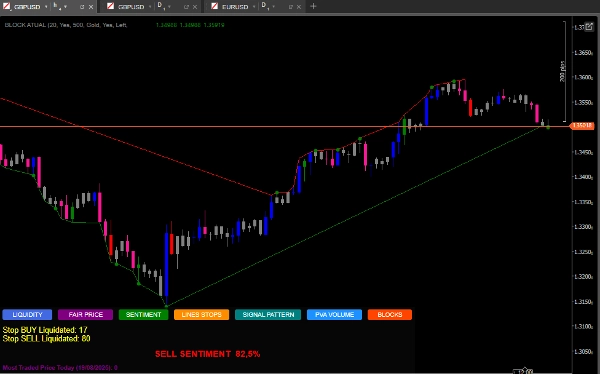
Tạo tín hiệu bán khi giá đóng cửa dưới một đỉnh chưa bị phá vỡ.
Phân tích Thanh khoản:
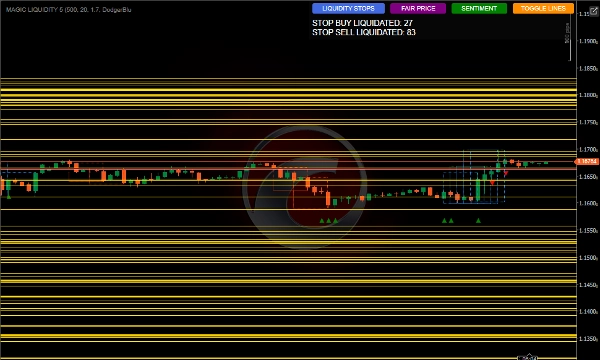
Phát hiện các vùng bể thanh khoản nơi các điểm dừng lỗ có thể tập trung.
Theo dõi việc kích hoạt các điểm dừng mua và bán.
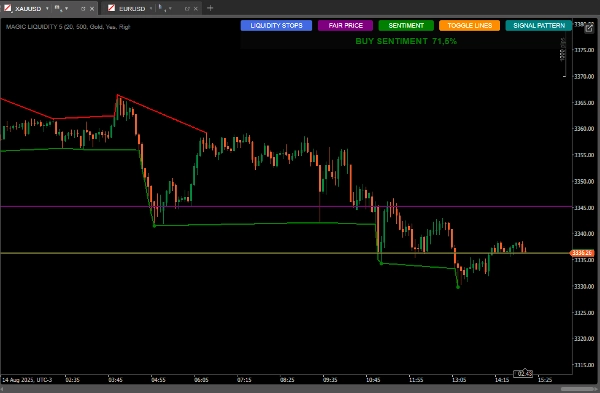
Tính toán tâm lý thị trường dựa trên phân phối thanh khoản.
Xác định giá công bằng được giao dịch nhiều nhất.
Cách Sử Dụng Để Đạt Kết Quả Tốt Nhất
Cấu Hình Ban Đầu
Khoảng Thời Gian Nhìn Lại: Điều chỉnh tham số Khoảng Thời Gian Nhìn Lại theo khung thời gian bạn giao dịch, giá trị cao hơn cho các khung thời gian lớn hơn.
Số Lượng Nến để Phân Tích: Giữ ở mức 500 để phân tích chắc chắn hoặc giảm để phản ứng nhanh hơn.
Màu Bể Thanh Khoản: Chọn màu nổi bật trên biểu đồ của bạn.
Diễn Giải Tín Hiệu
Tín hiệu Khối Lệnh:
Chấm xanh lá: Tín hiệu mua khi giá đóng cửa trên một đáy chưa bị phá vỡ.
Chấm đỏ: Tín hiệu bán khi giá đóng cửa dưới một đỉnh chưa bị phá vỡ.
Bể Thanh Khoản:
Các đường ngang hiển thị các vùng thanh khoản, mục tiêu tiềm năng hoặc điểm đảo chiều.
Theo dõi mối quan hệ giữa thanh khoản phía trên/dưới giá hiện tại.
Tâm Lý Thị Trường:
Sử dụng nút SENTIMENT để xem hướng đi và độ tin cậy hiện tại.
Tâm lý mua với độ tin cậy cao cho thấy sự tăng trưởng tiếp tục. Tâm lý bán với độ tin cậy cao cho thấy xu hướng giảm tiếp diễn.
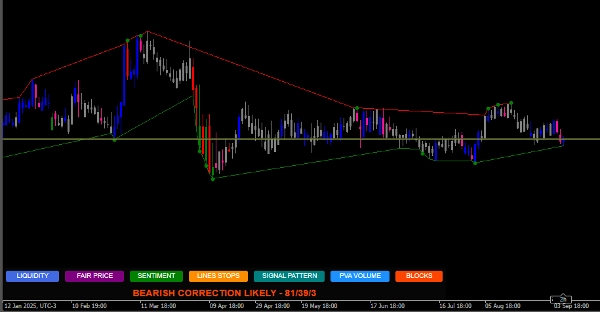
Mẫu Nến:
Nút SIGNAL PATTERN phân tích và
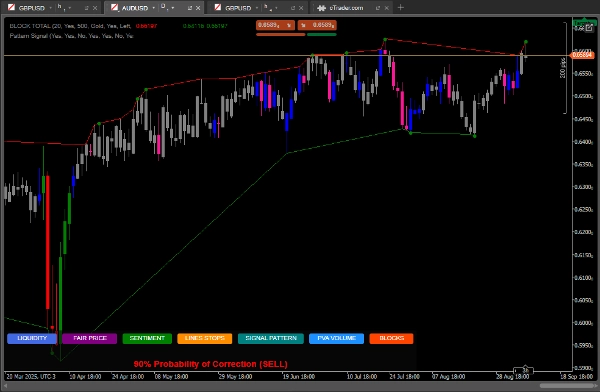
Hiển thị xác suất điều chỉnh dựa trên tỷ lệ định lượng
Giá Công Bằng Được Giao Dịch Nhiều Nhất:
Nút PRICE hiển thị mức giá có khối lượng giao dịch cao nhất trong ngày.
Nó có thể hoạt động như một nam châm hút giá hoặc như hỗ trợ/kháng cự.
Chiến Lược Sử Dụng
Chiến Lược Thận Trọng:
Chỉ giao dịch khi tín hiệu khối lệnh trùng với tâm lý thị trường hiện tại.
Sử dụng các bể thanh khoản làm mục tiêu chốt lời.
Chiến Lược Mạnh Mẽ:
Dự đoán đảo chiều khi giá tiếp cận các bể thanh khoản với nhiều điểm dừng tích lũy.
Sử dụng sự phân kỳ giữa tâm lý và hành động giá cho các giao dịch ngược xu hướng.
Xác Nhận Bổ Sung:
So sánh với mẫu nến được chỉ báo hiển thị.
Kiểm tra xem giá công bằng có gần đó như một vùng quan tâm không.
Quản Lý Rủi Ro.
Cắt Lỗ:
Đặt dưới khối lệnh gần nhất cho lệnh mua
Đặt trên khối lệnh gần nhất cho lệnh bán
Chốt Lời:
Mục tiêu trong các bể thanh khoản gần đó
Xem xét tỷ lệ thanh khoản trên/dưới để đặt mục tiêu
Mẹo Nâng Cao
Sử dụng nút TOGGLE LINES để tắt các đường thanh khoản khi biểu đồ trở nên lộn xộn
Theo dõi số lượng điểm dừng bị thanh lý để đánh giá sức mạnh của đợt di chuyển
Giá công bằng đặc biệt hữu ích trong các thị trường giới hạn như hỗ trợ/kháng cự động
Kết hợp với các chỉ báo khác để xác nhận khối lượng, trung bình động
MẪU TÍN HIỆU CÓ SẴN TRONG KHUNG THỜI GIAN D1.
https://ctrader.com/pt/products/1725?u=Goulart
https://ctrader.com/pt/products/1386?u=Goulart
Tóm tắt
The indicator also analyzes liquidity pools, highlighting areas where stop losses may accumulate and monitoring the activation of buy and sell stops. It calculates market sentiment based on liquidity distribution and identifies the most traded price level of the day, which can act as dynamic support or resistance.
Users can customize parameters such as lookback period and number of candles for analysis to suit different timeframes and trading styles. Visual signals include green and red dots for buy and sell order block signals, horizontal lines for liquidity pools, and sentiment indicators showing prevailing market direction and confidence.
The tool supports conservative strategies that align order block signals with sentiment and use liquidity pools as profit targets, as well as aggressive strategies that anticipate reversals near liquidity pools and exploit divergences between sentiment and price action. Additional features include candlestick pattern correction probabilities and options to toggle liquidity lines for chart clarity. Risk management guidance suggests placing stop-loss orders relative to recent order blocks and setting take-profit targets near liquidity pools.


![Logo "Gaussian Channel [Iridio Capital]"](https://cdn.ctrader.com/image/webp/7c039209-5573-4a54-a072-f9528b503103_41960)


