
Mô tả
PVA (Phân tích Giá - Khối lượng) là một phương pháp phân tích kỹ thuật nghiên cứu mối quan hệ giữa giá và khối lượng giao dịch của một tài sản tài chính. Ý tưởng cốt lõi đằng sau PVA là khối lượng giao dịch có thể cung cấp thông tin quan trọng về sức mạnh và hướng đi của xu hướng, giúp các nhà giao dịch đưa ra quyết định thông minh hơn.
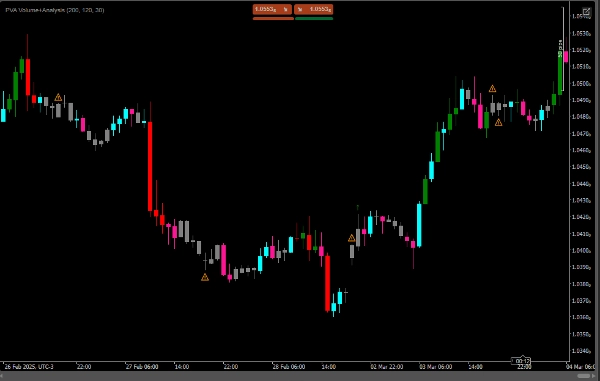
-Khối lượng tăng cùng với giá tăng: Chỉ ra một xu hướng tăng mạnh, và một biểu tượng màu xanh lá (mũi tên lên) được hiển thị.
-Khối lượng tăng cùng với giá giảm: Chỉ ra một xu hướng giảm mạnh, và một biểu tượng màu đỏ (mũi tên xuống) được hiển thị.
-Khối lượng giảm cùng với giá tăng: Chỉ ra rằng xu hướng tăng có thể đang mất sức mạnh, và một cảnh báo màu cam (biểu tượng cảnh báo) được hiển thị.
-Khối lượng giảm cùng với giá giảm: Chỉ ra rằng xu hướng giảm có thể đang mất sức mạnh, và một cảnh báo màu cam (biểu tượng cảnh báo) cũng được hiển thị.
-Nếu khối lượng giảm trong một chuyển động lên hoặc xuống, một dấu cảnh báo (⚠️) được vẽ.
Tóm tắt
- A green up arrow appears when volume increases alongside rising prices, indicating a strong uptrend.
- A red down arrow signals a strong downtrend when volume increases as prices fall.
- An orange warning symbol alerts when volume decreases during rising or falling prices, suggesting the current trend may be weakening.
- A general alert mark (⚠️) is displayed if volume declines during either upward or downward price movements.
This indicator assists traders by highlighting the interplay between price and volume, offering insights into the momentum behind market trends. It is designed for use in technical analysis to support more informed trading decisions.
Đánh giá của khách hàng
5 | 100 % | |
4 | 0 % | |
3 | 0 % | |
2 | 0 % | |
1 | 0 % |


