Mô tả
Mục tiêu chính:
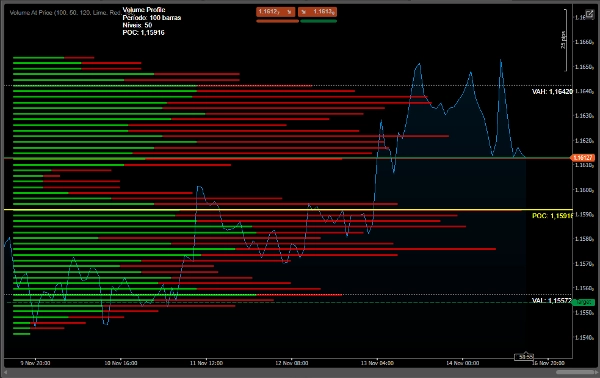
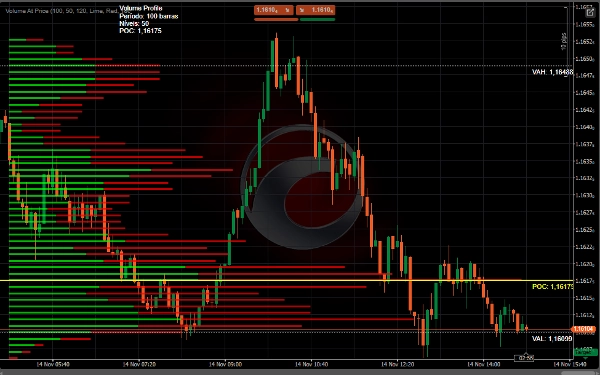
Bản đồ phân phối khối lượng theo mức giá để xác định:
Khu vực thanh khoản cao
Khu vực thanh khoản thấp
Sự mất cân bằng giữa người mua và người bán
Chỉ báo này rất mạnh để hiểu cấu trúc thị trường và xác định các khu vực có xác suất cao để giao dịch! 🎯
1. POC (Điểm kiểm soát)
Linha Amarela - Giá có khối lượng giao dịch cao nhất
Khu vực có thanh khoản và giá lớn nhất
Hỗ trợ/kháng cự tự nhiên
2. Khu vực giá trị
Các đường màu trắng - Khu vực nơi 70% khối lượng được giao dịch
VAH (Giá trị khu vực cao) - Giới hạn trên
VAL (Giá trị khu vực thấp) - Giới hạn dưới
Vùng cân bằng thị trường
3. Lõi khối lượng
🟢 Xanh lá - Khối lượng mua chiếm ưu thế
🔴 Đỏ - Khối lượng bán chiếm ưu thế
Chiều dài thanh = Cường độ khối lượng
📊 Sử dụng chiến lược
1. Xác định hỗ trợ và kháng cự
• POC hoạt động như hỗ trợ/kháng cự động
• Khu vực giá trị xác định vùng cân bằng
• Các cạnh quan trọng của hồ sơ S/R
2. Phân tích phá vỡ
• Phá vỡ trên VAH → Xu hướng tăng
• Phá vỡ dưới VAL → Xu hướng giảm
• Khối lượng không phá vỡ xác nhận chuyển động
3. Điểm vào lệnh
• Mua: Kiểm tra lại VAL với khối lượng người mua
• Bán: Kiểm tra lại VAH với khối lượng người bán
• Fade: Giao dịch ngược lại với các cực của hồ sơ
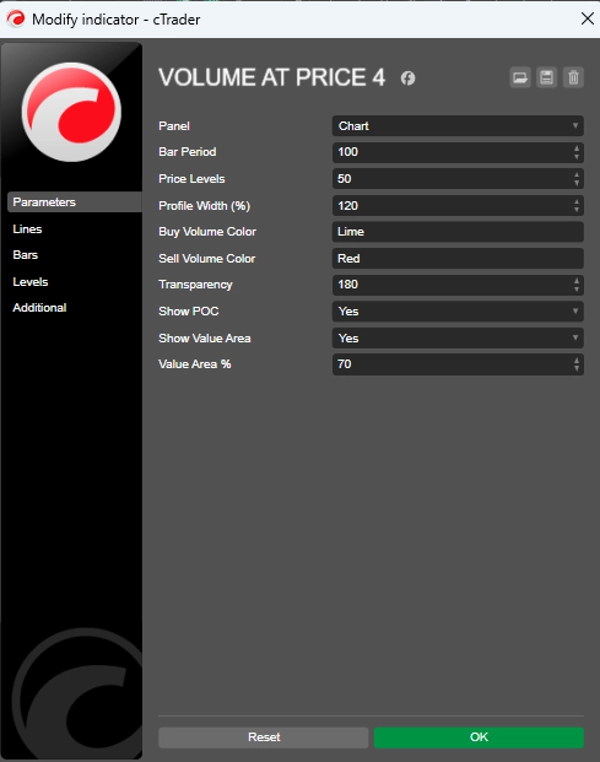
⚙️ Cấu hình được đề xuất
Cho giao dịch trong ngày
csharp
Chu kỳ = 50-100
Mức giá = 50
Độ rộng hồ sơ = 120%
Phần trăm khu vực giá trị = 70
Cho giao dịch Swing
csharp
Chu kỳ = 100-200
Mức giá = 80
Độ rộng hồ sơ = 150%
Phần trăm khu vực giá trị = 70
✅ ƯU ĐIỂM:
Xác định hỗ trợ/kháng cự động
Hiển thị ý định thị trường (khối lượng)
Tiết lộ các khu vực thanh khoản quan trọng
Hiển thị rõ ràng sự mất cân bằng
Đếm các tick khối lượng hiện tại
Tóm tắt
- Point of Control (POC): The price level with the highest traded volume, acting as a dynamic support or resistance.
- Value Area: The price range where 70% of volume is traded, defined by Value Area High (VAH) and Value Area Low (VAL), representing market balance zones.
- Volume Cores: Colored bars indicating dominant buying (green) or selling (red) volume, with bar length reflecting volume intensity.
The indicator supports strategies like identifying support and resistance levels, breakout analysis (trend direction based on VAH and VAL breaks), and entry points (buy near VAL with buyer volume, sell near VAH with seller volume, or fade at profile extremes).
Recommended settings vary by trading style: for day trading, shorter periods and narrower profiles; for swing trading, longer periods and wider profiles. This tool aids in visualizing liquidity, market intent, and volume imbalances to inform trading decisions.
Đánh giá của khách hàng
5 | 0 % | |
4 | 50 % | |
3 | 50 % | |
2 | 0 % | |
1 | 0 % |