
Mô tả
Hoàn thiện chiến lược của bạn với chỉ báo tín hiệu này👇🏻
https://ctrader.com/pt/products/1560?u=Goulart
✔Tính năng của chỉ báo
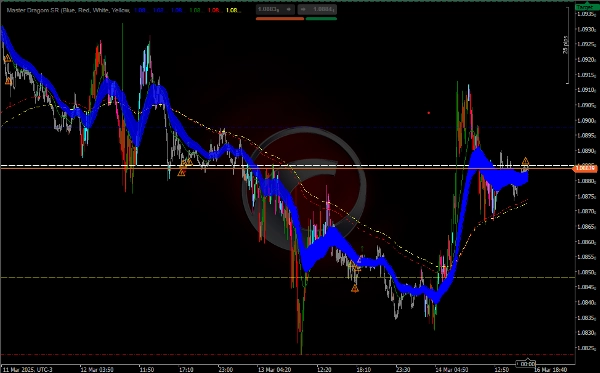
Hỗ trợ và Kháng cự (SR):
Chỉ báo vẽ các đường ngang cho các mức hỗ trợ và kháng cự hàng ngày, hàng tuần và hàng tháng.
Bạn có thể bật hoặc tắt từng mức (mở, đóng, cao và thấp) theo nhu cầu.
Đường Trung bình Động Lũy thừa (EMA):
Chỉ báo tính toán nhiều EMA (50, 25, 200 và 233 chu kỳ) để giúp xác định xu hướng và các khu vực hỗ trợ/kháng cự động tiềm năng.
Các EMA được vẽ trên biểu đồ với các màu sắc khác nhau để dễ quan sát.
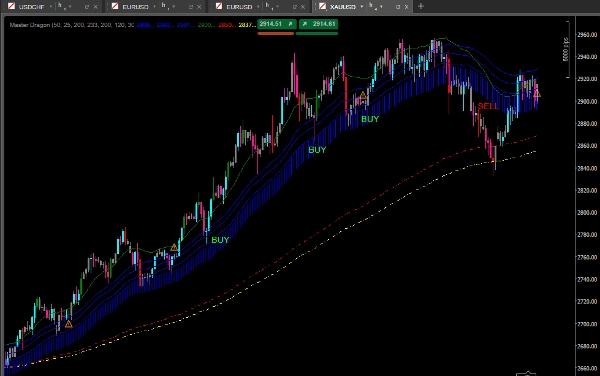
Phân tích Khối lượng (PVAVolumeAnalysis):
Chỉ báo phân tích khối lượng để xác định khả năng đảo chiều hoặc tiếp tục xu hướng.
Nó làm nổi bật các thanh có khối lượng trên mức trung bình và báo hiệu các thay đổi đáng kể về khối lượng bằng các biểu tượng (↑, ↓, ⚠️).
Tô màu thanh:
Các thanh được tô màu dựa trên khối lượng và hướng giá (tăng hoặc giảm), giúp xác định sức mạnh của xu hướng.
Phân tích Xu hướng với EMA:
Sử dụng EMA để xác định hướng của xu hướng:
Nếu giá nằm trên các EMA (đặc biệt là EMA 200 và 233), xu hướng là tăng.
Nếu giá nằm dưới các EMA, xu hướng là giảm.
Khu vực giữa EMA 50 Cao và Thấp có thể được sử dụng như một vùng quan tâm cho khả năng đảo chiều hoặc tiếp tục.
Phân tích Khối lượng:
Quan sát các biểu tượng và màu sắc thanh để nhận biết sự thay đổi về khối lượng:
Khối lượng cao với giá tăng (↑): Xác nhận xu hướng tăng.
Khối lượng cao với giá giảm (↓): Xác nhận xu hướng giảm.
Khối lượng thấp với giá tăng hoặc giảm (⚠️): Có thể đảo chiều.
Kết hợp các tín hiệu:
Kết hợp các tín hiệu về khối lượng, EMA và các mức SR để đưa ra quyết định vào hoặc thoát lệnh.
Ví dụ, nếu giá gần mức kháng cự và khối lượng giảm, đó có thể là tín hiệu đảo chiều.
Chiến lược đề xuất
Chiến lược Xu hướng với Xác nhận Khối lượng
Xác định Xu hướng:
Sử dụng EMA (200 và 233) để xác định xu hướng chính.
Nếu giá nằm trên các EMA, chỉ xem xét mua.
Nếu giá nằm dưới các EMA, chỉ xem xét bán.
Chờ Pullback:
Chờ giá quay lại EMA chu kỳ ngắn hơn (50 hoặc 25) hoặc mức SR.
Xác nhận với Khối lượng:
Kiểm tra xem khối lượng có tăng theo hướng xu hướng không (↑ cho mua, ↓ cho bán).
MA xác định xu hướng, pullback, tín hiệu khối lượng, đảo chiều, hỗ trợ và kháng cự.
Nếu khối lượng giảm (⚠️), tránh vào lệnh hoặc cân nhắc đảo chiều.
Vào lệnh:
Mua khi giá nằm trên các EMA và gần mức hỗ trợ, với khối lượng xác nhận xu hướng tăng.
Bán khi giá nằm dưới các EMA và gần mức kháng cự, với khối lượng xác nhận xu hướng giảm.
Thoát lệnh:
Sử dụng các mức SR hoặc EMA làm mục tiêu hoặc điểm thoát lệnh.
Ví dụ, đóng hoặc bán khi chạm mức hỗ trợ.
Tóm tắt
Volume analysis is integrated to detect potential trend reversals or continuations by highlighting bars with above-average volume and signaling significant volume changes using icons (↑ for rising volume confirming uptrends, ↓ for falling volume confirming downtrends, and ⚠️ for low volume indicating possible reversals). Bars are color-coded based on volume and price direction to visually represent trend strength.
Traders can combine signals from volume, EMAs, and support/resistance levels to make informed entry and exit decisions. A suggested strategy involves identifying the main trend using the 200 and 233 EMAs, waiting for pullbacks to shorter EMAs or support/resistance levels, and confirming with volume signals before entering trades. Exit points can be set at support/resistance levels or EMA lines. This indicator is suitable for enhancing trend, pullback, volume, reversal, and support/resistance analysis in various trading strategies.
Đánh giá của khách hàng
5 | 100 % | |
4 | 0 % | |
3 | 0 % | |
2 | 0 % | |
1 | 0 % |


