
Consolidation Zones
Chỉ báo
1 lượt mua
Phiên bản 1.0, Oct 2025
Windows, Mac
4.0
Đánh giá: 1
Mô tả
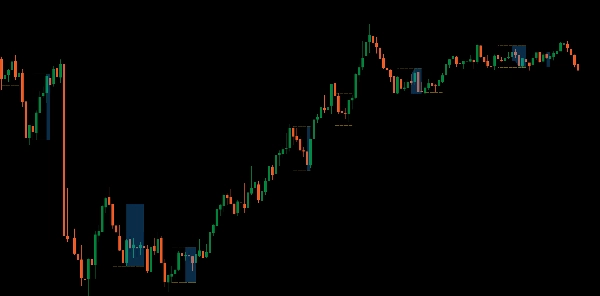
Giới thiệu Chỉ báo Vùng Tích Lũy, được thiết kế để giúp bạn xác định và tận dụng các cơ hội bứt phá một cách dễ dàng.
Công cụ mạnh mẽ này làm nổi bật các vùng trên biểu đồ của bạn nơi giá đang tích lũy, giúp bạn dễ dàng phát hiện các điểm bứt phá tiềm năng. Bằng cách trực quan hóa những khu vực quan trọng này, bạn có thể dự đoán tốt hơn các biến động thị trường và đưa ra các quyết định giao dịch thông minh hơn.
Lý tưởng cho các nhà giao dịch muốn nâng cao chiến lược của mình với những hiểu biết rõ ràng và có thể hành động, hãy nâng cấp bộ công cụ giao dịch của bạn và làm chủ các đợt bứt phá với chỉ báo Vùng Tích Lũy.
Tóm tắt
Tóm tắt AI
The Consolidation Zones indicator identifies and visualizes price consolidation areas on trading charts to help traders spot potential breakout points. By highlighting these zones, it assists in anticipating market movements and supports more informed decision-making. This tool is applicable across multiple markets, including Forex, cryptocurrencies (e.g., BTCUSD), commodities (e.g., gold, oil), indices (e.g., NAS100, SP500), and stocks. It is designed to enhance trading strategies focused on breakout opportunities by providing clear visual cues of consolidation phases.
Hồ sơ chỉ báo
Đánh giá của khách hàng
4.0
Đánh giá: 1
5 | 0 % | |
4 | 100 % | |
3 | 0 % | |
2 | 0 % | |
1 | 0 % |
Đánh giá của khách hàng
October 12, 2025
Two timeframes give more context, and the log becomes easier to read.
Thảo luận
Câu hỏi thường gặp
BTCUSD
Forex
Breakout
Indices
EURUSD
Commodities
GBPUSD
NZDUSD
Prop
Crypto
Stocks
XAUUSD
NAS100
USDJPY
Các sản phẩm có sẵn trên cTrader Store, bao gồm bot giao dịch, chỉ báo và plugin, được cung cấp bởi các nhà phát triển bên thứ ba và chỉ nhằm mục đích cung cấp thông tin và tiếp cận kỹ thuật. cTrader Store không phải là nhà môi giới và không cung cấp lời khuyên đầu tư, khuyến nghị cá nhân hay bất kỳ đảm bảo nào về hiệu suất trong tương lai.


Giá
Kể từ 25/09/2025
25
Lượt bán
315
Cài đặt miễn phí