
Standard Deviation Channel
指标
2 购买
版本 1.0, Oct 2025
Windows 版、Mac 版
5.0
评价:1
说明
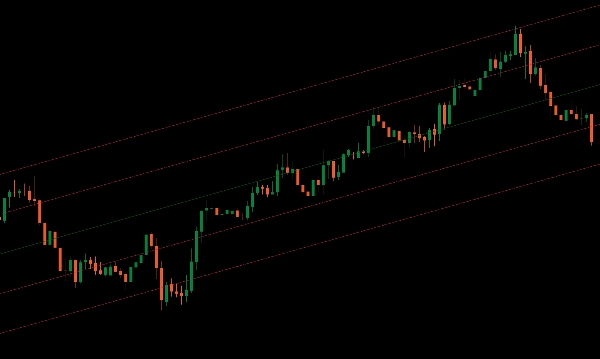
介绍 标准差通道 指标,适用于 cTrader,是一个强大的工具,旨在帮助您精准地可视化市场趋势。
该指标在您的图表上显示指定周期的中位数,提供价格变动的中心参考点。
此外,它允许您添加所需数量的上下通道,按标准差的倍数计算,让您清晰地看到价格波动性和潜在的突破区域。
标准差通道指标非常适合寻求增强分析能力的交易者,帮助您轻松识别趋势方向和潜在的反转点。
使用标准差通道升级您的交易工具包,实现更优的市场分析和决策。
摘要
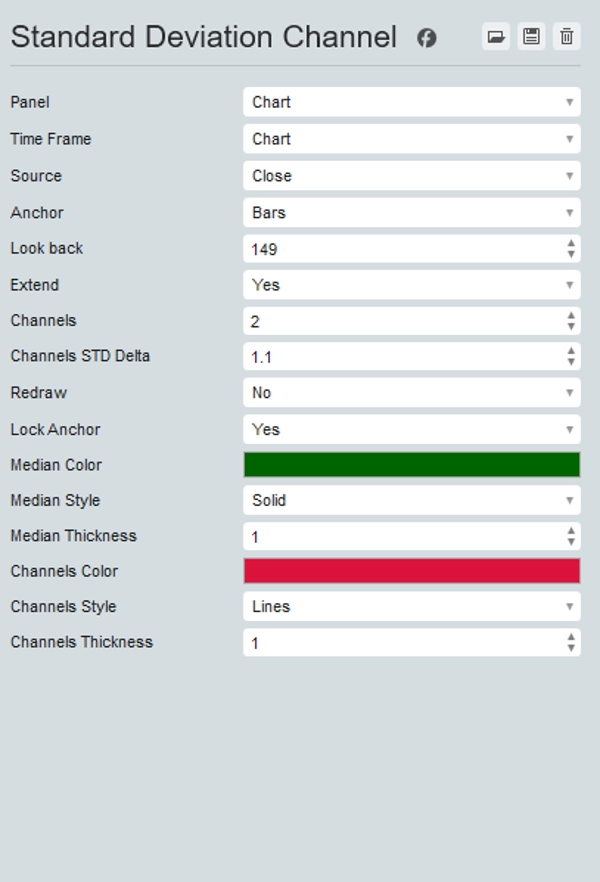
指标配置
客户评价
5.0
评价:1
5 | 100 % | |
4 | 0 % | |
3 | 0 % | |
2 | 0 % | |
1 | 0 % |
客户评价
October 31, 2025
The product earns time when it makes the setup easier to question, and 3 sessions is a fair first sample.
讨论
常见问答
BTCUSD
Forex
Breakout
Indices
EURUSD
Commodities
GBPUSD
NZDUSD
Prop
Scalping
Crypto
Grid
Stocks
XAUUSD
NAS100
USDJPY
cTrader Store 提供的所有产品,包括交易机器人、指标和插件,均由第三方开发者提供,仅供信息参考和技术访问之用。cTrader Store 并非经纪商,不提供投资建议、个人推荐或任何未来业绩保证。


!["Gaussian Channel [Iridio Capital]" 标识](https://cdn.ctrader.com/image/webp/7c039209-5573-4a54-a072-f9528b503103_41960)


价格
注册日期 25/09/2025
25
销售
331
免费安装