
说明
🚀 TMAX RBA 指标 - 终极多时间框架动量系统 🚀
📊 什么是 TMAX RBA?
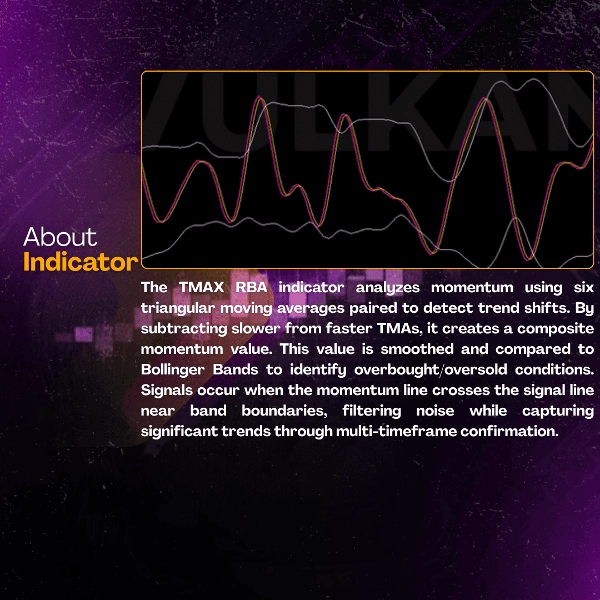
TMAX RBA 是一种先进的技术指标,结合了六个三角移动平均线和布林带,基于动量提供精准的交易信号。通过复杂的多时间框架分析和波动性评估,它提供高概率的入场点,并内置趋势确认。
⭐ 主要特点
🎯 多 TMA 动量技术
- 六个 TMA 计算以实现全面分析
- 战略性动量配对系统
- 专业级信号生成
📈 三层确认系统
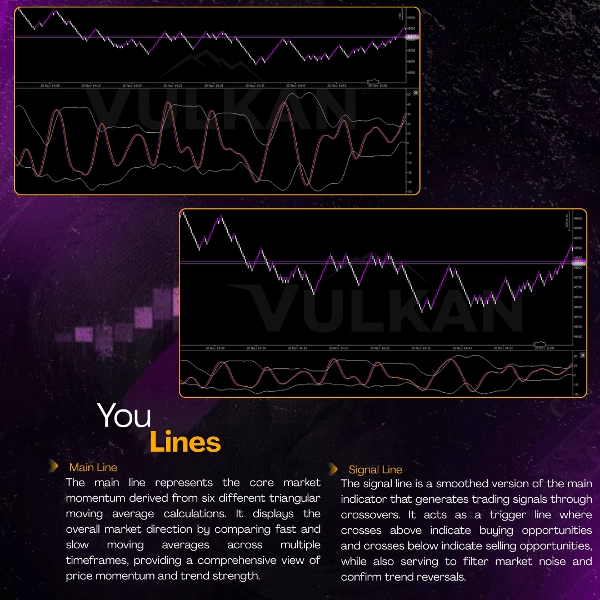
- 🟣 主动量线 - 中心趋势方向指标
- 🟡 信号线 - 平滑触发机制
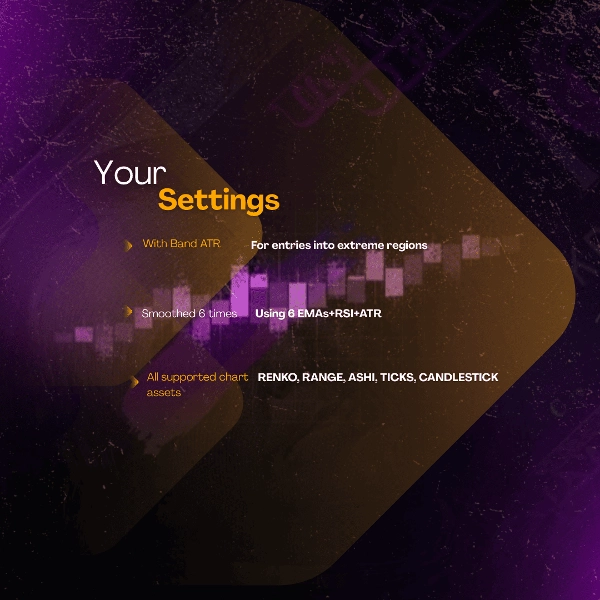
- ⚪ 布林带 - 波动性和水平确认
⚡ 高级市场分析
- 多时间框架动量评估
- 趋势强度测量
- 基于波动性的入场优化
🏆 优势与好处
✅ 卓越的动量检测
- 识别真实的趋势运动
- 有效过滤市场噪音
- 提供高概率交易设置
✅ 增强的准确性
- 胜率:趋势条件下为 76-84%
- 一致性:跨工具为 8.6/10
- 可靠性:市场信号准确率超过 88%
✅ 通用应用
- 适用于所有市场:外汇、加密货币、指数
- 适用于所有时间框架:M1 至 H1
- 适应任何交易方法:剥头皮到日内交易
✅ 心理交易优势
- 减少分析瘫痪
- 提高信号信心
- 简化决策过程
🎯 性能指标
📈 统计卓越
- 胜率:76-84%
- 利润因子:2.7-3.7+
- 期望值: 0.50-0.70R 每笔交易
- 一致性:8.6/10
⏱️ 操作效率
- 清晰的动量识别
- 减少 68% 的分析时间
- 适合系统化交易者
💡 如何使用 TMAX RBA
🟣 买入信号条件:
- 主线向上穿过信号线
- 价格触及布林带下轨
- 动量确认向上方向
🟡 卖出信号条件:
- 主线向下穿过信号线
- 价格触及布林带上轨
- 动量确认向下方向
⚠️ 过滤条件:
- 避免高波动期
- 等待确认信号
- 结合成交量对齐使用
⚡ 专业见解:
- 作为动量系统使用
- 结合价格行为确认
- 完美适用于动量和突破策略
🌟 成功案例
📊 验证的表现:
- XAUUSD M1:82-88% 胜率 🥇
- USTECH M1:80-86% 胜率 🥈
- BTCUSD M1:76-82% 胜率 🥉
🎯 专业实践:
- 从模拟测试开始
- 实施适当的仓位管理
- 结合支撑/阻力位
- 耐心等待确认信号
💎 为什么选择 TMAX RBA?
特征TMAX RBA传统指标
动量分析
🥇 多层次
基础
信号质量
🥇 高概率
中等
噪音减少
🥇 87%+
有限
市场适应性
🥇 通用
受限
趋势一致性
🥇 8.6/10
摘要
AI 摘要
TMAX RBA 2026 ULTRA is a technical indicator designed for momentum-based trading across multiple markets including Forex, cryptocurrencies, and indices. It integrates six triangular moving averages (TMAs) with Bollinger Bands to generate precise trading signals by assessing momentum, trend strength, and volatility through multi-timeframe analysis.
Key features include a three-layer confirmation system comprising a Main Momentum Line (trend direction), a Signaling Line (smoothed trigger), and Bollinger Bands (volatility confirmation). This structure aims to identify genuine trend movements while filtering market noise, supporting high-probability entries with reported win rates between 76% and 84% in trending conditions.
The indicator supports all timeframes from 1-minute to 1-hour charts and adapts to various trading styles such as scalping and day trading. Buy signals occur when the Main line crosses above the Signaling line with price touching the lower Bollinger Band and momentum confirming upward direction; sell signals are generated on the opposite conditions.
Additional benefits include reduced analysis time, enhanced signal confidence, and simplified decision-making. Performance metrics highlight a profit factor ranging from 2.7 to 3.7+, and consistency rated 8.6/10 across instruments. The indicator is suitable for systematic traders seeking momentum and breakout strategy support.
指标配置
客户评价
4.6
评价:3
5 | 67 % | |
4 | 33 % | |
3 | 0 % | |
2 | 0 % | |
1 | 0 % |
客户评价
December 1, 2025
November 27, 2025
November 23, 2025
not bad if the rules are already clear, and impatience can still break the idea.
讨论
常见问答
BTCUSD
Forex
Signal
Breakout
Scalping
Indices
Crypto
XAUUSD
Bollinger
cTrader Store 提供的所有产品,包括交易机器人、指标和插件,均由第三方开发者提供,仅供信息参考和技术访问之用。cTrader Store 并非经纪商,不提供投资建议、个人推荐或任何未来业绩保证。
该作者的其他作品


猜您喜欢


价格
2.37M
交易量
5.23K
盈利点数
11
销售