
说明
该指标分析内容
XAUUSD 流动性引擎绘制了价格上下方的止损聚集区——价格反复被吸引然后反转的休眠流动性。它为每个区域评分概率,突出显示每侧最可能的单一目标,并在您的交易时段偏好与目标对齐时组装完整的交易设置。
专为黄金(XAUUSD)打造。适用于 M5、M15、M30 和 H1。
v2.1 新增功能——完整的 ICT 杀戮区框架
杀戮区现锚定于 纽约本地时间,并自动调整美国夏令时,因此时间窗口全年保持正确——而不仅仅是半年。包含所有四个 ICT 杀戮区:
- 亚洲 杀戮区
- 伦敦 杀戮区
- 纽约 杀戮区
- 伦敦收盘 杀戮区
每个杀戮区绘制为一个 限定于该时段自身高低点的方框——即该时段实际交易的区间——而非全高背景条。该区间 就是流动性:时段高低点正是后续时段追逐的水平。
如何解读图表
- 红色区域(BSL)——价格上方的买方止损聚集区。通常在下跌前被扫除。
- 蓝色区域(SSL)——价格下方的卖方止损聚集区。常在上涨前被触及。
- ★ 优质区域——在七个汇聚因素(H1 多时间框架重叠、FVG、等高/低点、时段水平、前日高低、整数位、磁铁层级)中评分为7–10。这些区域在图表上突出显示。
- 杀戮区方框——四个 ICT 时段,每个框定其自身的高低区间。
- 流动性目标线——价格上下方概率最高的单一目标,每个带有评分标识。
- 前日高/低——绘制于 ICT 纽约午夜日界线,并延伸至当前交易日结束,确保今日关键水平始终可见。
- 交易设置面板——当时段偏好与目标对齐时,仪表盘显示方向、入场区、止损、目标和风险回报比。
仪表盘
一个分区的图表内仪表盘,一目了然地读取当前情况:
- 叙述——偏好和目标的通俗解读
- 市场——H4 / 低时间框架结构及优质/折价区域
- 流动性——目标、前日水平、BSL / SSL 区域计数
- 执行——实时信号、ATR、点差、活跃杀戮区
- 背景——汇聚、订单块、FVG、时段参与
文本对比度现 自动适应您的图表背景——无论白底还是暗底图表均可阅读,无需更改设置。
三种模式
- 初学者——仅显示区域、目标和时段偏好。图表简洁,决策最少。
- 标准(推荐)——增加 FVG、区间背景、汇聚评分和交易设置面板。
- 专业——完整仪表盘,包含订单块、H1 多时间框架区域、信号叠加及所有智能层。
关键设置
- 模式——初学者 / 标准 / 专业;控制可见层级
- 杀戮区——所有四个 ICT 窗口以纽约时间显示,支持夏令时自动调整(可单独调节)
- 前日基准——ICT 纽约午夜(默认)或经纪商日线
- 汇聚接近度——水平必须多近才算作汇聚
- 区域最大年龄——区域淡出前的最大柱数
- 目标距离(ATR)——流动性目标的最大搜索范围
典型使用场景
- 交易前规划——查看伦敦或纽约可能扫除的止损聚集区
- 扫除后的入场——等待 BSL / SSL 被扫除,然后在回测时行动
- 目标选择——使用评分目标线来设定止盈
- 时段时机——顺应 ICT 杀戮区窗口交易,而非逆势
适用对象
- 使用 ICT、SMC 或基于流动性分析的 M5–H1 黄金交易者
- 希望获得结构而无需每个时段重绘区域的交易者
- 希望获得简洁、引导视图的初学者(初学者模式)
- 希望获得完整机构视图的高级交易者(专业模式)
重要说明
- 针对 XAUUSD 优化。默认参数针对黄金波动性调整。
- 杀戮区使用纽约本地时间,自动调整美国夏令时。
- 时段偏好使用 H4 结构——请允许加载 200+ 根柱以获得准确的首次读取。
- 交易设置面板需要同时启用时段偏好和流动性目标。
- 在无刻度成交量数据的经纪商上,成交量激增过滤器会自动禁用。
资产 2 — 版本历史条目(v2.1)
选择适合您方案的版本号——v2.1 是从实时 v2.0 自然演进的一步。
版本 2.1 — 2026年6月
- 新增: 现包含所有四个 ICT 杀戮区——亚洲、伦敦、纽约和伦敦收盘(之前仅伦敦+纽约)。
- 新增: 杀戮区锚定纽约本地时间,自动处理美国夏令时——时间窗口全年保持正确。
- 变更: 每个杀戮区现绘制为限定于该时段实际高低点(时段区间)的方框,而非全高带状。
- 变更: 前日高/低现使用 ICT 纽约午夜日界线,并延伸至当前交易日结束。
- 新增: 仪表盘自动对比——文本自动适应浅色或深色图表背景。
- 改进: 仪表盘重新组织为清晰分区(叙述 / 市场 / 流动性 / 执行 / 背景)。
- 改进: 右侧标签——水平、目标和交易设置——错开排列成整洁列;杀戮区标签错落,避免相邻时段重叠。
资产 3 — 截图计划(8 个位置)
通用捕捉规则:
- 捕捉 在活跃市场时间内,确保点差真实且信号可打印(避免周末“点差40点/信号关闭”状态的英雄截图)。
- 保持一致的缩放和干净的图表(隐藏无关对象)。
- 自动对比支持两种主题——考虑一张浅色背景和一张深色背景截图以展示区间。
- 全程使用相同的 XAUUSD 品种以保持一致性。
#截图 内容要求 销售理由
1
英雄概览
标准模式,完整图表:4 个杀戮区方框,PDH/PDL,目标线,可读仪表盘
第一印象——“这是一个完整的专业黄金工具”
2
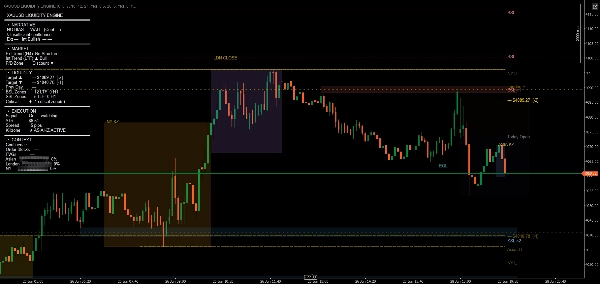
全部4个杀戮区
全天包含亚洲/伦敦/纽约/伦敦收盘方框标注,每个紧贴其时段区间
v2.1 头条功能;展示真实的 ICT 准确性
3
信号激活 ⭐
专业模式,信号叠加开启,打印设置:入场区、止损/止盈1/止盈2标签,风险回报比,交易设置面板填充
展示头条交易设置功能及整洁的标签列
4
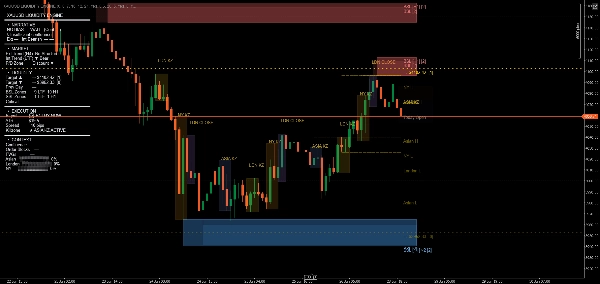
流动性区域
BSL(红色)+ SSL(蓝色)区域,带有★优质区域突出显示,评分可见
展示评分/概率引擎
5
流动性目标
价格上下方带评分标识的虚线金色目标线
一目了然显示“下一个目标”预测
6
仪表盘细节
裁剪、缩放的仪表盘,五个部分均可读
证明深度而不至于淹没图表
7
三种模式
初学者 vs 标准 vs 专业(堆叠或并排裁剪)
展示从简洁到完整的进阶;扩大买家基础
8
关键水平
PDH/PDL 延伸至日终 + 时段高低标签整齐排列
强化“始终了解您的水平”的价值
如果只刷新几个,优先级为 #1、#2、#3。#3 也是最后的质量确认——捕捉它可验证止损/止盈标签与实时信号不重叠。
摘要
Key features include color-coded liquidity zones (red for buy-side stops above price, blue for sell-side stops below), premium zones scored across multiple confluence factors, and liquidity target lines with probability scores. The indicator also displays Previous Day High/Low levels based on the ICT midnight-New York day boundary.
A comprehensive on-chart dashboard provides a plain-language narrative of session bias and objectives, market structure, liquidity details, execution signals, and contextual information such as order blocks and fair value gaps. The dashboard adapts text contrast automatically for light or dark chart backgrounds.
Users can select from three modes—Beginner (simplified view), Standard (adds confluence and trade setup), and Pro (full institutional-level detail). The indicator supports pre-session planning, entry timing after liquidity sweeps, target selection, and session timing aligned with ICT killzones.
客户评价
5 | 33 % | |
4 | 67 % | |
3 | 0 % | |
2 | 0 % | |
1 | 0 % |


