
Advanced RSI Indicator
指标
485 下载
版本 1.0, Apr 2025
Windows 版、Mac 版
5.0
评价:1

说明
🧠 高级RSI指标 – 精准动量分析
通过更智能的RSI深入洞察市场趋势
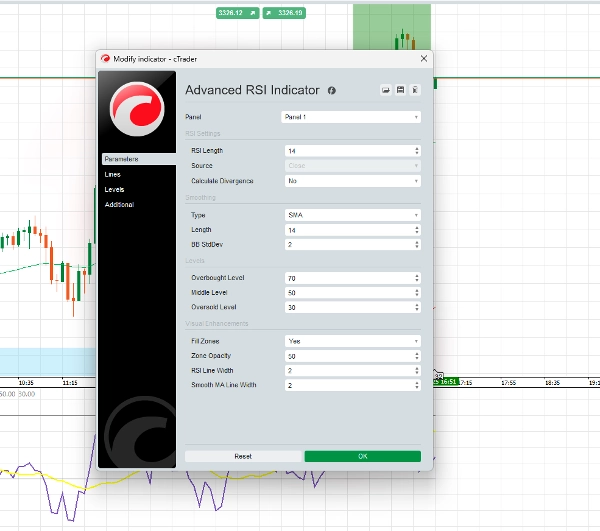
高级RSI指标 是经典RSI工具的强大进化版,专为重视精准和智能信号过滤的交易者开发。通过先进的算法平滑、自适应区域和集成的背离检测,该工具为所有市场和时间框架提供精细的动量分析。
🔍 主要特点:
✅ 平滑的RSI曲线
减少波动和假信号,更清晰地洞察市场趋势。
✅ 自适应信号区间
超越传统的70/30水平,采用响应市场波动的动态阈值。
✅ 颜色编码的动量区间
通过直观的视觉设计快速评估多头或空头动量。
✅ 背离提醒
突出显示多头和空头背离设置,支持策略决策。
✅ 自定义提醒系统
设置RSI水平穿越和背离信号提醒,确保不错过关键时刻。
✅ 多资产,多时间框架
优化用于外汇、加密货币、股票、指数等多种资产,适用于M1至日线图。
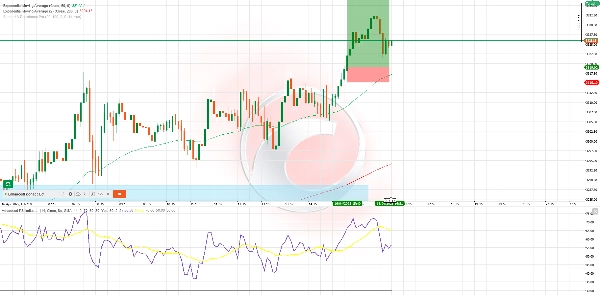
⚙️ 策略示例 – RSI波浪骑乘
适用: H1和H4波段交易
使用指标: 高级RSI,50 EMA,200 EMA
买入示例:
- 价格位于50和200 EMA之上
- RSI跌至40以下后开始回升
- 出现多头动量颜色
- (可选)检测到多头背离
- 入场:信号上方蜡烛收盘
- 止损:低于最后一个波段低点
- 止盈:风险的1.5倍至2倍或最近阻力位
卖出示例:
- 价格位于50和200 EMA之下
- RSI升至60以上后开始下跌
- 空头动量颜色确认方向
- (可选)空头背离增强信号
- 入场:确认蜡烛收盘
- 止损:高于最后一个波段高点
- 止盈:风险的1.5倍至2倍或最近支撑位
💬 交易者选择此工具的原因:
- 用户友好且功能强大
- 信号不重绘
- 经过主要市场测试
- 可单独使用或与其他策略结合
摘要
AI 摘要
The Advanced RSI Indicator is an enhanced version of the classic Relative Strength Index tool designed for precise momentum analysis across all markets and timeframes. It features advanced algorithmic smoothing to reduce noise and false signals, adaptive signal zones that adjust dynamically to market volatility, and color-coded momentum zones for quick visual assessment of bullish or bearish trends. Integrated divergence alerts highlight potential bullish or bearish setups, supporting strategic decision-making. The indicator includes a customizable alert system for RSI level crossings and divergence signals, ensuring timely notifications. It is optimized for multi-asset use, including forex, cryptocurrencies, stocks, and indices, and supports timeframes from one minute to daily charts. A sample strategy, "RSI Wave Ride," demonstrates its application in H1 and H4 swing trades using the Advanced RSI alongside 50 and 200 EMAs. The tool provides non-repainting signals and can be used standalone or combined with other strategies. Key features include smoothed RSI curves, adaptive zones, divergence detection, and multi-timeframe compatibility.
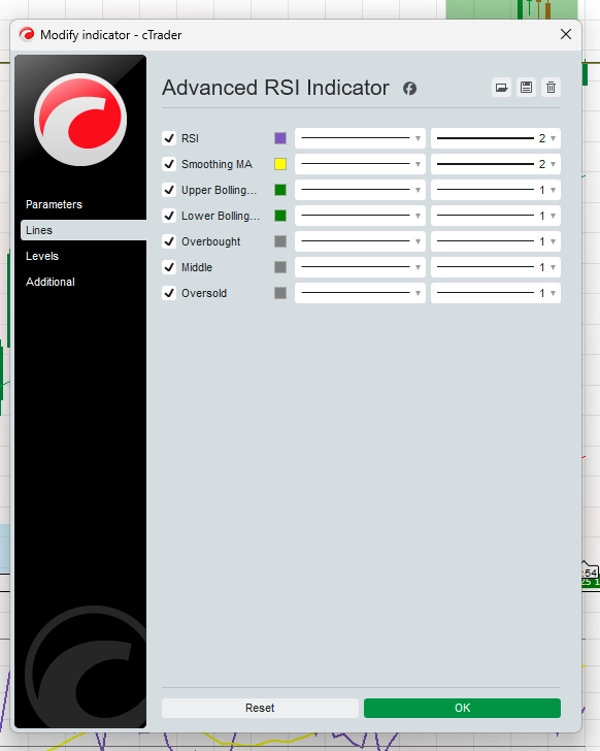
指标配置
客户评价
5.0
评价:1
5 | 100 % | |
4 | 0 % | |
3 | 0 % | |
2 | 0 % | |
1 | 0 % |
客户评价
August 18, 2025
Pros: Enhanced RSI with adaptive levels, clear visuals, and flexible settings. Works well on all timeframes for trend confirmation and reversal detection. Cons: No alerts or template saving. Can generate noise on lower timeframes without filters.
讨论
常见问答
Forex
Signal
Indices
RSI
Crypto
Stocks
cTrader Store 提供的所有产品,包括交易机器人、指标和插件,均由第三方开发者提供,仅供信息参考和技术访问之用。cTrader Store 并非经纪商,不提供投资建议、个人推荐或任何未来业绩保证。


价格
注册日期 22/11/2024
133
销售
2.57K
免费安装