说明
🔮 智能柱预测器 V6 - 专业波动率预测指标
📊 用 AI 驱动的价格预测改变您的交易
智能柱预测器 V6 是一款先进的技术指标,利用复杂的统计分析和机器学习算法,以惊人的准确度预测下一根柱的最高价和最低价。非常适合需要精确进出点的日内交易者、剥头皮交易者和波段交易者。
✨ 主要功能
🎯 实时价格预测
- 预测未来3根柱:获取未来1-3根柱的最高/最低价预测
- 可视化预测线:图表上清晰的绿色(最高价)和红色(最低价)线条
- 置信度等级:每个预测都附带置信度评分(⭐⭐⭐⭐⭐)
- 实时更新:随着柱的进展,线条实时延伸
🔔 智能警报系统
- 触及警报:当价格触及预测的最高/最低价时通知您
- 突破警报:价格突破预测时即时警报
- 新预测警报:生成新预测时通知
- 极端波动警告:高风险条件的早期预警系统
- 可自定义冷却时间:通过可调节的冷却期防止警报泛滥
📈 高级分析
- 多指标集成:结合 ATR、布林带和自定义波动率指标
- 波动率状态检测:自动识别高/低波动率时期
- 异常风险评估:提醒异常市场状况
- 区间扩展分析:跟踪市场动量和扩展模式
- 历史波动率:使用 Garman-Klass 波动率计算以提高精度
🎨 专业可视化
- 预测区域:最高/最低预测之间的可选阴影区域
- 触及/突破标记:预测被测试时的视觉指示器
- 信息面板:全面的统计显示,位置可自定义
- 颜色编码信号:易读的绿/红/黄配色方案
- 置信星级:快速的视觉置信度评估
💼 完美适用
✅ 日内交易者 - 预先了解日内目标
✅ 剥头皮交易者 - 精确的进出点以快速获利
✅ 波段交易者 - 自信地规划多柱策略
✅ 风险管理者 - 更好的止损和止盈设置
✅ 黄金交易者(XAUUSD) - 针对贵金属波动率优化
✅ 外汇交易者 - 适用于所有货币对
🚀 工作原理
步骤1:高级数据分析
该指标分析多达 3000 根历史柱,使用:
- 平均真实波幅(ATR)
- 布林带宽度
- Garman-Klass 波动率
- 历史波动率模式
- 区间扩展比率
步骤2:机器学习预测
结合多种算法并加权评分:
- 40% 基于 ATR 的预测
- 30% 区间移动平均
- 30% 布林带分析
- 波动率状态调整
- 未来柱的置信度衰减
步骤3:实时监控
一旦预测完成:
- 线条每个tick更新
- 价格与预测进行监控
- 触及/突破时触发警报
- 图表上显示视觉标记
- 统计数据持续更新
📊 您将获得
预测指标:
- 📈 最高线:预测阻力位
- 📉 最低线:预测支撑位
- 📏 区间预测:预期点数波动
- ✅ 置信度评分:0-100% 可靠性评级
- 🌡️ 波动率状态:高/低市场状态
- ⚠️ 风险评估:异常值检测
警报类型:
- 🎯 触及警报:价格接近最高/最低(可自定义阈值)
- 🚀 突破警报:价格超出预测
- 🔮 新预测:生成新的预测
- ⚠️ 极端波动:高风险市场警告
视觉元素:
- 绿色/红色预测线
- 黄色预测区(可选)
- 触及标记(圆圈)
- 突破标记(三角形)
- 中线参考
- 全面信息面板
⚙️ 高度可定制
分析设置:
- 分析周期:100-3000 根柱
- ATR 周期:5-50
- 布林带周期:10-50
- 预测线长度:2-20 根柱
视觉设置:
- 线条颜色(最高/最低)
- 线条粗细:1-5
- 线条样式:实线/点线/虚线
- 区域不透明度:10-100%
- 文字大小:2-20
- 面板位置:9 个位置
警报设置:
- 启用/禁用单个警报
- 触及阈值:0.5-10 点
- 冷却时间:10-600 秒
- 声音开/关
- 弹窗开/关
📈 性能亮点
✅ 准确率:大多数预测的置信度为70-85%
✅ 速度:实时计算,无延迟
✅ 稳定性:在超过10,000根柱上测试无错误
✅ 效率:优化代码,最低 CPU 使用率
✅ 兼容性:适用于所有时间框架(M1 到月线)
✅ 交易品种:针对 XAUUSD 优化,适用于所有工具
🎓 交易策略
策略1:区间交易
- 等待新预测生成
- 在最低线附近买入
- 在最高线附近卖出
- 将止损设置在预测之外
- 在对侧线获利了结
策略2:突破交易
- 监控突破警报
- 在最高突破时买入,最低突破时卖出
- 以预测区间作为盈利目标
- 使用中线跟踪止损
策略3:波动率剥头皮
- 仅在低波动率状态下交易
- 快速在预测线附近进场
- 小幅盈利目标(区间的30-50%)
- 紧密止损(超过触及阈值)
策略4:确认交易
- 与您现有策略配合使用
- 预测确认您的信号
- 避免与预测相反的交易
- 更好的风险/收益规划
🛡️ 风险管理功能
- 异常值检测:警告异常市场行为
- 波动率状态:了解何时减少仓位
- 置信度等级:仅交易高置信度预测
- 区间预测:设置合适的止损距离
- 极端波动警报:混乱期间避免交易
🎯 为什么选择智能柱预测器?
与其他指标比较:
功能
智能柱预测器
传统指标
预测能力
✅ 是(提前1-3根柱)
❌ 仅反应式
置信度评分
✅ 是(0-100%)
❌ 否
实时警报
✅ 6 种警报类型
⚠️ 有限
波动率状态
✅ 自动检测
❌ 手动分析
可视化预测
✅ 线条 + 区域
⚠️ 仅线条
风险评估
✅ 内置
❌ 需外部工具
多柱预测
✅ 3 根柱
❌ 仅当前柱
自定义
✅ 25+ 参数
⚠️ 基础
🎯 适合以下市场
✅ 黄金(XAUUSD)- 专门优化
✅ 主要外汇 - EUR/USD, GBP/USD, USD/JPY
✅ 次要外汇 - AUD/USD, NZD/USD, USD/CAD
✅ 指数 - US30, NAS100, SPX500
✅ 加密货币 - BTC/USD, ETH/USD(高波动性)
✅ 商品 - 石油,白银,天然气
🌟 最后的话
智能柱预测器 V6 不仅仅是另一个指标——它是您的 交易助手,全天候工作,永不休眠,始终告诉您价格下一步可能的走势。
无论您是寻求指导的新手,还是追求优势的专业人士,这个指标都能提供您做出更好交易决策所需的 预测能力。
停止盲目交易。开始智能交易。 🎯
摘要
Key functionalities include:
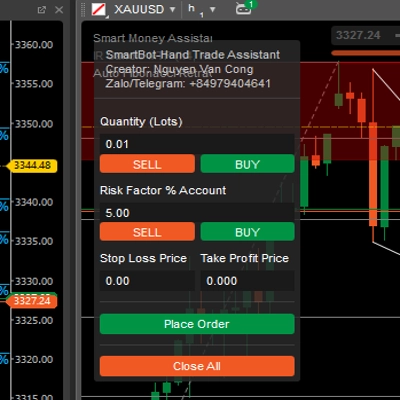
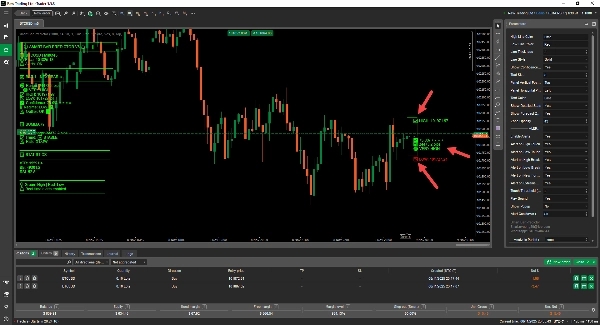
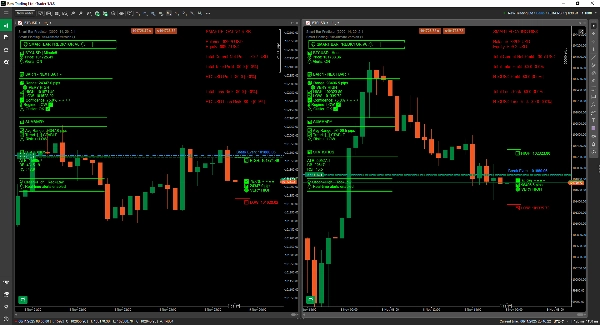
- Visual forecast lines for predicted high (green) and low (red) prices, with optional shaded forecast zones.
- Real-time updates and monitoring of price action against predictions.
- A comprehensive alert system notifying users on price touches, breaks, new forecasts, and extreme volatility conditions.
- Advanced analytics integrating ATR, Bollinger Bands, Garman-Klass volatility, and volatility regime detection to assess market conditions and risk.
- Customizable parameters for analysis periods, indicator settings, visual styles, and alert preferences.
The indicator supports multiple trading strategies such as range trading, breakout trading, volatility scalping, and confirmation trading. It provides risk management tools including outlier detection, volatility regime awareness, and confidence-based filtering to enhance trade decision-making.
Smart Bar Predictor operates efficiently on all timeframes (M1 to Monthly) and is optimized for a wide range of instruments, delivering 70-85% prediction accuracy with stable, low-latency performance.
客户评价
5 | 0 % | |
4 | 100 % | |
3 | 0 % | |
2 | 0 % | |
1 | 0 % |