
说明
📈 PineScriptLabs 智能信号 CDRC [自动止盈/止损]
❓ 这是什么指标?
动态收盘区间通道(CDRC)系统 是基于 PineScriptLabs 理论 开发的指标,使用 两个独立通道 生成 买卖信号 📊 并且 自动计算动态止盈(TP)和止损(SL) 🎯,且每次都 不相同。
🎯 特殊动态止盈/止损算法 ⚡
不同于使用固定水平或ATR的系统,该算法根据 最后信号以来的实际价格变动 计算止盈和止损:
• 多头 📈:测量从 最低记录价格 到入场价的距离,计算该变动的 百分比,并将该百分比 向上投射 以设定目标
• 空头 📉:测量从 最高记录价格 到入场价的距离,并将该百分比 向下投射
🎯 这意味着每笔交易都有根据当时特定市场环境调整的独特水平,反映了信号前的真实动量 💡
📊 CDRC 理论:通道构建 🏗️
技术基础 🔍
CDRC 理论仅基于 收盘价区间 构建通道,而非波动率或标准差。收盘价代表真实的市场共识,消除影线噪音 🎯
构建过程 ⚙️
- 平均价格:所有周期收盘价的平均值
- 区间:周期内最高和最低收盘价的差值
- 振幅:区间 × 乘数 ÷ 2
- 通道带:
o 上轨 = 平均价格 + 振幅 ↗️
o 下轨 = 平均价格 - 振幅 ↘️
🔄 通道在每根K线重新计算,不断适应市场
⚙️ 它是如何工作的?
两个同时运行的通道 📊📊
• 通道1(快速 - 111根K线):对变化反应快,乘数0.14 ⚡
• 通道2(慢速 - 388根K线):长期视角,乘数0.11 🐢
信号生成 🎯
• 多头 ✅:价格连续2根K线收盘高于 两个通道的上轨 🟢
• 空头 ✅:价格连续2根K线收盘低于 两个通道的下轨 🔴
🛡️ 双重确认过滤虚假信号
🤖 自动止盈/止损计算(算法细节)
多头 📈:
- 系统持续记录 最后信号以来的最低价
- 生成买入信号时,计算: 百分比 = (入场价 - 最低价) / 入场价 × 100
- 将该百分比向上投射 从入场价设定 TP3
- 将区间分为三个区域:TP1(33%),TP2(66%),TP3(100%)
- 止损 = 入场价 - (入场价 × 百分比 × 止损比例 / 100)
空头 📉:
- 系统持续记录 最后信号以来的最高价
- 生成卖出信号时,计算: 百分比 = (最高价 - 入场价) / 入场价 × 100
- 将该百分比向下投射 从入场价设定 TP3
- 将区间分为三个递进区域
- 止损 = 入场价 + (入场价 × 百分比 × 止损比例 / 100)
🎯 结果:每笔交易都有根据当时特定市场动量计算的独特水平。
👀 可视化 🎨
• 点:两个通道的通道带
• 动态填充:通道被突破时变色
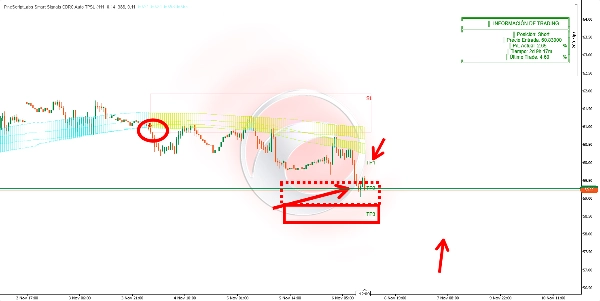
• 方框:入场区间(止损-入场)和三个目标区间(递进透明度)
• 标签:止损,TP1,TP2,TP3,显示精确价格 🏷️
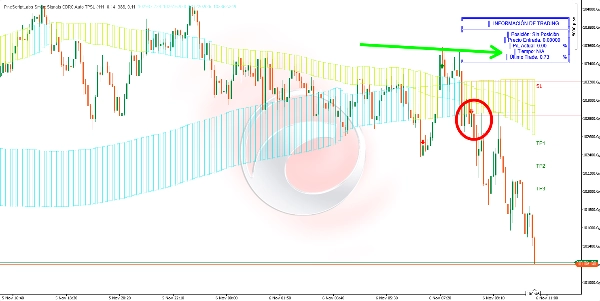
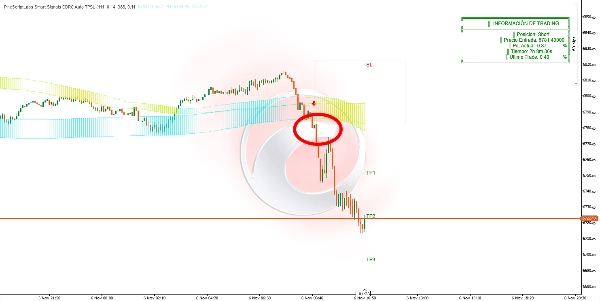
• 箭头:绿色(买入)🟢 / 红色(卖出)🔴
• 表格:当前持仓,入场价,当前盈亏百分比,持仓时间,最近平仓交易 📋
🎯 用途是什么?
- 高概率入场,双时间框架确认 ✅
- 基于实际市场变动的自适应自动风险管理 🤖
- 独特的分层目标,根据之前的动量为每笔交易设定 🎯
- 动态适应 最近的价格行为 🔄
- 实时监控 持仓表现 📊
🛠️ 如何使用?
入场 🚀:箭头出现时于K线收盘入场
管理 💼:
• TP1:预计变动的33%(部分获利) 💰
• TP2:预计变动的66%(更多获利) 💰💰
• TP3:预计变动的100%(最终目标) 🎯
• 止损:始终遵守自动止损 ⛔
监控 👀:表格实时显示当前盈亏。系统自动检测是否达到TP3或止损。 同一时间仅允许一个有效信号 ⚠️
⚙️ 参数及影响
通道1周期(111):
• ↑ 更多K线 = 信号更少,更可靠,反应更慢 🐢
• ↓ 更少K线 = 信号更多,更快,更敏感 ⚡
通道1乘数(0.14):
• ↑ 更高 = 通道带宽,信号更少,仅强劲波动 💪
• ↓ 更低 = 通道带窄,信号更多,灵敏度更高 🎯
通道2周期(388):
• ↑ 更高 = 严格确认,信号更少 🛡️
• ↓ 更低 = 信号更多,过滤较少 📊
通道2乘数(0.11):
• ↑ 更高 = 严格过滤,保守 🎯
• ↓ 更低 = 灵敏度更高,交易更多 ⚡
止损比例(50%):
• 50% = 1:2 比例(专业平衡:风险1,利润2) ⚖️
• ↑ 趋近100% = 止损宽,风险大,止损少,风险回报比差 📉
• ↓ 趋近1% = 止损紧,风险小,风险回报比好,止损多 📈
🔑 关键注意事项
• 市场记忆 🧠:记录最后信号以来的价格极值,实现真实且独特的投射
• 止盈/止损永不相等 ⚖️:每笔交易的水平根据其特定环境计算
• 必须连续2根K线双重确认 ✅✅
• 同一时间仅允许一个有效信号 ⚠️
• 通道不断重新计算,适应市场 🔄
• 方框视觉延伸,保持可见性 👀
🚀 已有超过10,000名交易者使用我们的顶级 指标 🏆
👉 在这里获取我们所有顶级系统:
_______________________________________________
📌 市场结构指标
· ✅ 高级市场结构:Bos,Choch,SwinLevels,订单区块,市场结构及流动性探测器
· 🔄动态市场结构转折点分析
· 🧱 订单区块
· ⚖️ 市场失衡
· ⛓️ BOS & CHOCH
· 🧠 ICT 三力
· 🌀 市场极性区
_______________________________________________
🔚 智能退出系统
· 📍 追踪智能算法
_______________________________________________
📐 之字形指标
· 🔍 之字形价格流动性投射
· 🧭 支撑阻力结构之字形
· ➖ 之字形
· 🎯 之字形极端追踪器
_______________________________________________
🧱 支撑与阻力指标
· 🟩 智能趋势支撑与阻力线
· 🧱 所有支撑与阻力水平
_______________________________________________
📊 趋势与通道指标
· 🔄 自动趋势通道
· 📊 超级趋势
· ⚡动量趋势分析器
· 🧠 自适应趋势通道
· 💥 通道突破系统
· 🌈 动态趋势渐变
· ⭐ 高级SSL通道
· 🔁 反应性移动平均线
_______________________________________________
💧 成交量与流动性工具
· 🔥 成交量POC热力图
· 📉 杠杆清算图
· 🔍 动量公平价值缺口
· 🕒 公平价值缺口时段
_______________________________________________
⚡ 动量与RSI指标
· 📈 RSI趋势触发器
· 🚀 动态区间动量
· 🔎 多级蜡烛偏向
追踪器
_______________________________________________
🔮 预测与投射工具
· 📐 基于线性回归和ATR的预测
· 📏 斐波那契线性回归多时间框架
· 📈 成交量驱动市场流动投射器
摘要
客户评价
5 | 67 % | |
4 | 0 % | |
3 | 33 % | |
2 | 0 % | |
1 | 0 % |


!["High-Low Divergence [Iridio Capital]" 标识](https://cdn.ctrader.com/image/webp/443c4661-7abb-40f1-842f-4b6ec560649b_40914)


