
说明
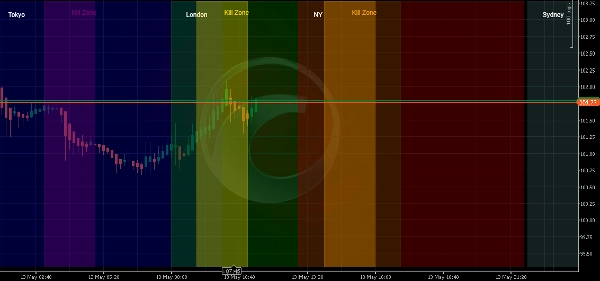
Session & Kill Zone Highlighter 是一个专业的视觉指示器,专为遵循 ICT/SMC 方法论的交易者设计,或仅仅是想准确知道任何给定时间哪个市场交易时段处于活跃状态的用户。
🔱 它的功能
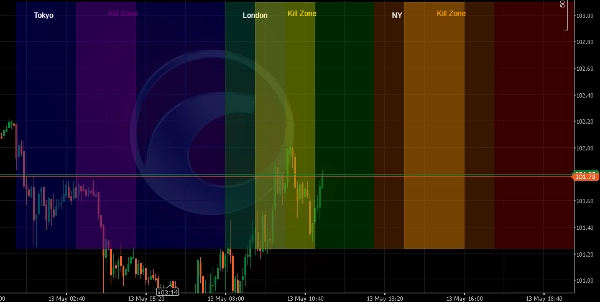
该指标直接在您的图表上绘制透明彩色矩形,覆盖所有主要外汇交易时段:
• 悉尼时段 (UTC: 22:00 - 07:00)
• 东京时段 (UTC: 00:00 - 09:00)
• 伦敦时段 (UTC: 07:00 - 16:00)
• 纽约时段 (UTC: 12:00 - 21:00)
此外,它还突出显示最具流动性的 ICT 杀戮区:
• 亚洲杀戮区 (02:00 - 04:00 UTC)
• 伦敦杀戮区 (08:00 - 10:00 UTC)
• 纽约杀戮区 (13:00 - 15:00 UTC)
🔱 主要特点
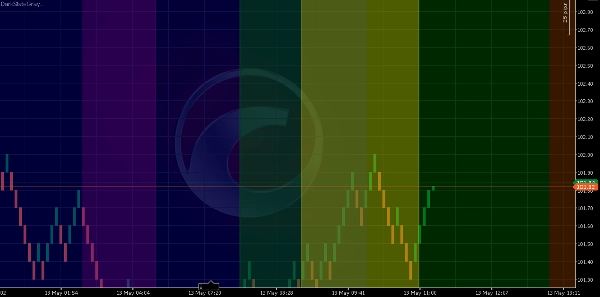
✔ 兼容所有图表类型:Renko、蜡烛图、折线图、Tick、区间、成交量、点数图和Kagi图
✔ 完全可自定义的交易时段时间和颜色
✔ 可调节的时段和杀戮区不透明度(0.1 到 0.9)
✔ 可选的时段标签和垂直边界线
✔ 自动每日重绘
✔ 支持隔夜时段(例如悉尼)
🔱 为什么你需要它
• 不再猜测哪个市场处于活跃状态
• 一目了然地识别最具流动性的交易时间
• 通过视觉确认应用 ICT 方法论
• 节省时间——无需手动绘线
• 适用于任何时间框架和任何交易工具(外汇、指数、加密货币、大宗商品、股票)
🔱 价格与试用
• 常规价格:19美元
• 7天完全功能免费试用(无功能限制)
• 一次性付款,终身许可
🔱 重要说明
• 该指标设计为直接应用于图表面板。即使您在属性中选择“新面板”,指标仍会正确绘制在图表上。
• 所有时间均为 UTC。指标自动处理日期转换和隔夜时段。
• 7天试用期结束后,指标将停止工作并显示提示信息。请购买完整版以继续使用。
⚠️免责声明:交易存在亏损风险。过去的表现不保证未来结果。该指标是一个视觉工具,旨在帮助交易者识别市场交易时段。它不生成交易信号。请始终使用适当的风险管理。
📝 支持:如有疑问、功能请求或需要支持,请通过 cTrader 商店联系开发者。
祝您使用 Session & Kill Zone Highlighter 交易愉快!
摘要
The indicator supports all chart types, including Renko, Candlestick, Line, Tick, Range, Volume, Point & Figure, and Kagi. Users can customize session times, colors, and opacity levels (0.1 to 0.9), and enable optional session labels and vertical boundary lines. It automatically redraws daily and correctly handles overnight sessions such as Sydney.
This tool aids traders in identifying active market sessions and the most liquid trading hours at a glance, facilitating application of the ICT/SMC trading methodology. It works on any timeframe and instrument type, including Forex, Indices, Crypto, Commodities, and Stocks. All times are in UTC, and the indicator is applied directly to the chart panel.
客户评价
5 | 100 % | |
4 | 0 % | |
3 | 0 % | |
2 | 0 % | |
1 | 0 % |