
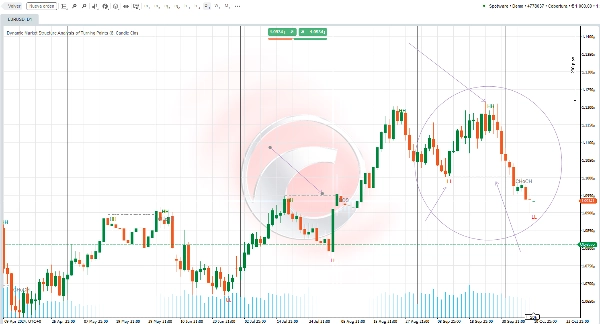
Dynamic Market Structure Analysis of Turning Points
指标
11 购买
版本 1.0, Oct 2024
Windows 版、Mac 版
4.3
评价:3
说明
Pinescritlabs
Ctrader Store 指标: 🤖Pinescritlabs Ctrader Store cBots:
指标设置概览 🌟
摆动长度 📏
此参数决定在寻找摆动点时,向左和向右考虑多少根柱子。较低的值会显示更多点,而较高的值会减少它们的数量。建议根据您的交易风格以及切换不同时间框架时调整此参数。
CHOCH 🔄
启用此选项将把第一个反趋势突破重命名为 CHoCH(特征变化),从而表示市场方向可能发生转变。
HH 和 LL 📈📉
指标将在图表上绘制摆动高点(HH)和摆动低点(LL),帮助您更有效地可视化市场结构。
BOS ⚡
当检测到摆动点的突破时,指标还会显示结构突破(BOS)水平,提供对市场动态的额外洞察。
摘要
AI 摘要
Dynamic Market Structure Analysis of Turning Points is a trading indicator designed to identify key market structure elements on price charts. It detects and plots swing high points (HH) and swing low points (LL) to visualize market swings. The indicator highlights Break of Structure (BOS) levels, signaling breakout points that may indicate shifts in market dynamics. An optional feature renames the first counter-trend breakout as CHoCH (Change of Character), marking potential changes in market direction. Users can adjust the swing length parameter to control the sensitivity and number of detected swing points, tailoring the indicator to different timeframes and trading styles. This tool supports analysis across various markets including cryptocurrencies (BTCUSD, ETH), commodities (gold, oil, silver), and forex symbols like XAUUSD. It integrates with the cTrader platform and complements other indicators such as RSI, Supertrend, and ZigZag for comprehensive market analysis. The indicator aims to assist traders in making informed decisions by clearly outlining market turning points and structural changes.
指标配置
客户评价
4.3
评价:3
5 | 33 % | |
4 | 67 % | |
3 | 0 % | |
2 | 0 % | |
1 | 0 % |
客户评价
October 14, 2024
Good for cautious traders for smart money style analysis. it adds structure around liquidity, gaps and market shifts, especially when used for mapping zones before entries. For SMC logic, I trust zones more when 0.5 mitigation, BOS and liquidity sweep line up. The zone is more convincing when structure and risk both make sense.
October 13, 2024
October 13, 2024
Fair tool for structure for a more controlled workflow. It helps with mapping zones before entries, but zones still need manual validation. For SMC logic, I trust zones more when 0.5 mitigation, BOS and liquidity sweep line up. I would still keep manual review in the process.
讨论
常见问答
BTCUSD
Breakout
Supertrend
Commodities
RSI
Crypto
XAUUSD
cTrader Store 提供的所有产品,包括交易机器人、指标和插件,均由第三方开发者提供,仅供信息参考和技术访问之用。cTrader Store 并非经纪商,不提供投资建议、个人推荐或任何未来业绩保证。


!["[Stellar Strategies] MARSI Signal Plotter" 标识](https://cdn.ctrader.com/image/webp/7b2b8da6-8f8e-4646-8d4a-4710c516c01e_25567)


!["High-Low Divergence [Iridio Capital]" 标识](https://cdn.ctrader.com/image/webp/443c4661-7abb-40f1-842f-4b6ec560649b_40914)


价格
注册日期 03/10/2024
163
销售
37.88K
免费安装