

说明
带有动态颜色变化和成交量的高级MACD指标
描述: 我们的高级MACD指标不仅仅是一个简单的柱状图。该指标旨在提供清晰且动态的市场趋势视图,具有独特功能,使其成为任何严肃交易者不可或缺的工具。
主要特点:
- 动态颜色变化:
-
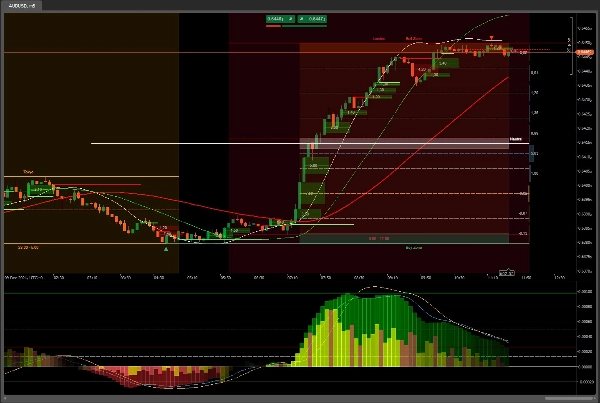
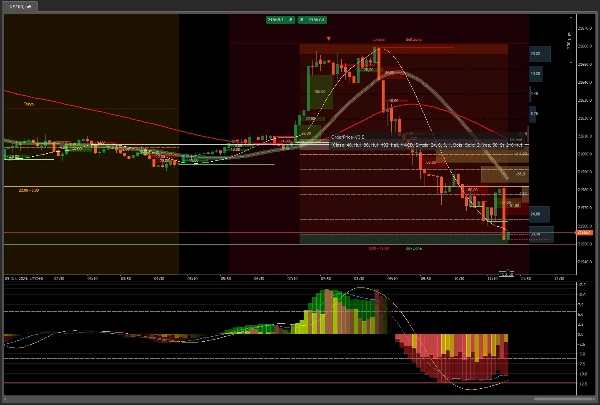
- 正向: 随着数值增加,柱状图从绿色变为白色,清晰展示看涨趋势。
- 负向: 随着数值减少,柱状图从红色变为白色,突出显示看跌趋势。
- 成交量指标:
-
- 正向成交量: 以绿色柱表示,表明交易量增加。
- 负向成交量: 以红色柱表示,表明交易量减少。
- 清晰可视化: 成交量柱的颜色组合(绿色、黄色、棕色、红色)提供了市场买卖活动的清晰视图。
- 自动缩放:
-
- 保持指标居中并自动调整以获得最佳视图,无需频繁手动调整。
- 可定制移动平均线:
-
- 包含一个额外的移动平均线,您可以从可用选项中选择,允许更大程度的定制和适应您的交易策略。
- 高点和低点:
-
- 显示所选周期内的最高和最低水平,提供市场极值的清晰视图。
优势:
- 视觉清晰: 动态颜色变化使识别市场趋势和转折点变得容易。
- 定制化: 选择不同的移动平均线和调整颜色级别的能力,使您能够根据具体需求调整指标。
- 高效性: 自动缩放确保您始终拥有最佳的指标视图,无需手动调整。
- 全面分析: 包含成交量和高/低水平,提供更完整的市场视图。
适用对象:
- 寻求高级且可定制工具以增强技术分析的交易者。
- 希望获得清晰且动态市场趋势可视化的人士。
- 重视交易工具效率和定制化的用户。
配合以下附加工具
OrderPrice V3 https://ctrader.com/products/397
NTMPICLL https://ctrader.com/products/327
Range Box Level https://ctrader.com/products/245
Or RangeBoxFibonacci https://ctrader.com/products/526
Market Session https://ctrader.com/products/525
MacdVolume https://ctrader.com/products/267
4MA https://ctrader.com/products/247
你将无敌
祝你好运 😀
摘要
AI 摘要
The MACDVolume indicator is an advanced technical analysis tool combining the Moving Average Convergence Divergence (MACD) histogram with volume data for enhanced market trend visualization. It features dynamic color changes in the MACD histogram: bullish trends are shown by a gradient from green to white, while bearish trends shift from red to white. The volume component uses color-coded bars—green for increasing volume and red for decreasing volume—with additional colors (yellow, brown) to clearly depict buying and selling activity.
Key functionalities include auto zoom, which keeps the indicator centered and optimally scaled without manual adjustment, and a customizable moving average that can be selected from available options to fit different trading strategies. The indicator also displays the highest and lowest price levels within the selected period, providing insight into market extremes.
Designed for traders seeking a customizable and efficient tool, MACDVolume offers clear visual cues for trend identification and comprehensive market analysis by integrating volume and price extremes. It supports markets such as Forex and Stocks and is suitable for users who prioritize clarity, customization, and efficiency in their technical indicators.
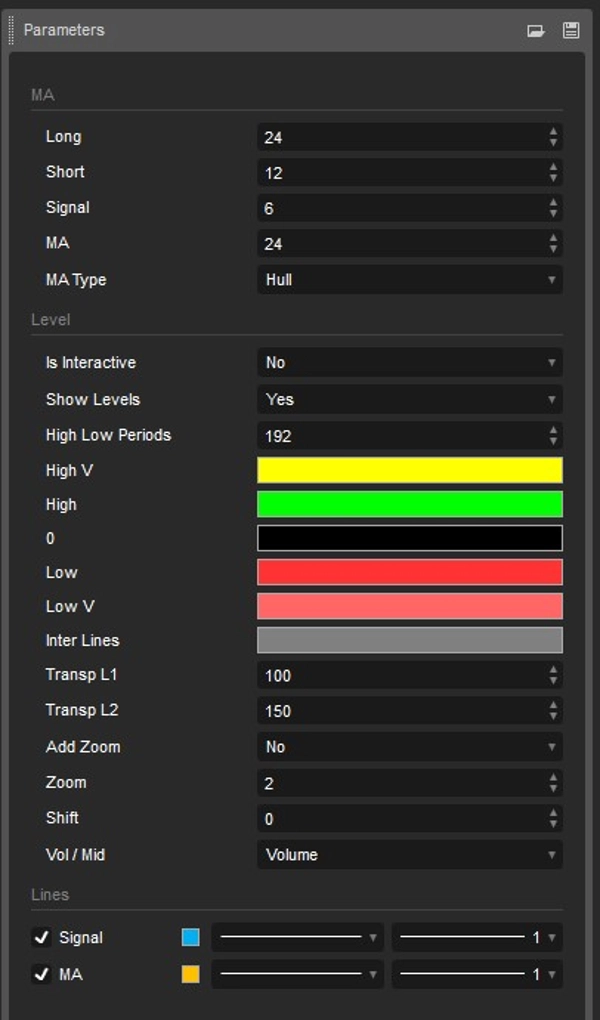
指标配置
客户评价
5.0
评价:3
5 | 100 % | |
4 | 0 % | |
3 | 0 % | |
2 | 0 % | |
1 | 0 % |
客户评价
January 12, 2026
August 28, 2025
MACDVolume is a strong complementary tool for traders already using MACD. It enhances decision-making by incorporating volume, making signals more trustworthy.
April 17, 2025
讨论
常见问答
Forex
Stocks
MACD
cTrader Store 提供的所有产品,包括交易机器人、指标和插件,均由第三方开发者提供,仅供信息参考和技术访问之用。cTrader Store 并非经纪商,不提供投资建议、个人推荐或任何未来业绩保证。
该作者的其他作品


价格
147
销售
11.2K
免费安装