


说明
描述:
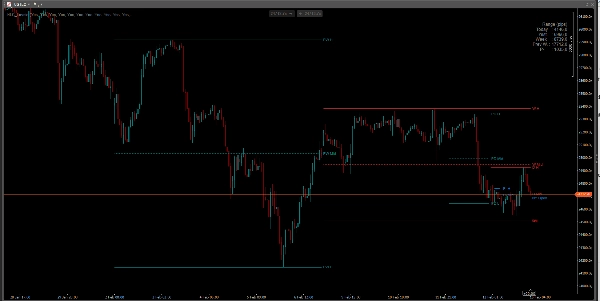
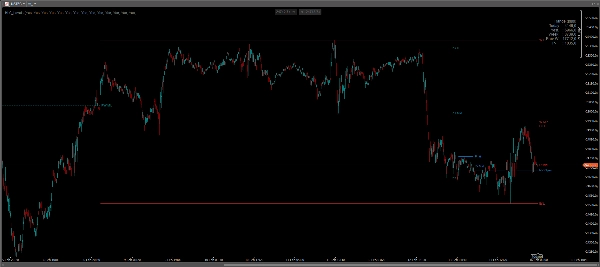
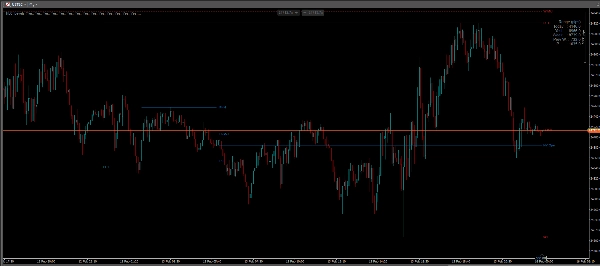
停止每天手动绘制线条。高级HLC和会话级别 是为依赖机构参考点的专业交易者设计的综合指标。无论您交易价格行为、ICT概念还是突破策略,该工具都能保持您的图表整洁,水平精准。
主要功能:
- 每日水平: 自动显示今日和昨日的最高、最低及中间(50%)水平。
- 每周水平: 可视化当前和上周的最高、最低及中间水平。
- 纽约午夜开盘: 专门的切换选项,用于机构纽约00:00价格水平(真实日开盘),对方向偏好至关重要。
- 自定义范围/会话: 定义您自己的时间窗口(例如亚洲时段、伦敦开盘或初始平衡)。指标将绘制该特定期间的最高、最低和中间水平。
- 波动率仪表盘: 图表上的表格显示日内、昨日、本周、上周及自定义范围的点差(最高减最低)。
- 时区智能: 支持经纪商时间、UTC、纽约或本地时间,确保水平与您的策略一致。
为什么使用此指标?
- 反应点: 旧的高点/低点和中点通常作为强支撑和阻力。
- 中点(均衡): 50%水平是识别“折扣”与“溢价”定价的关键。
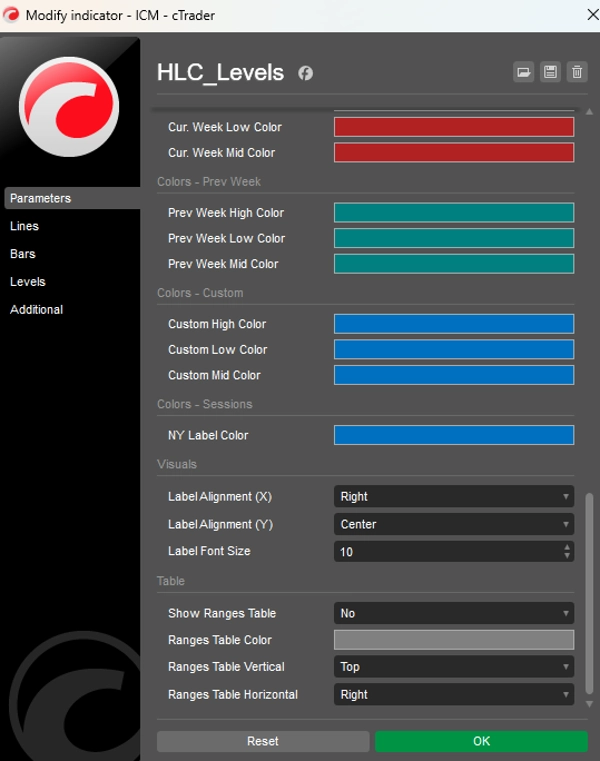
- 完全可定制: 可切换任意线条开关。更改颜色、线条样式和标签位置以匹配您的模板。
设置:
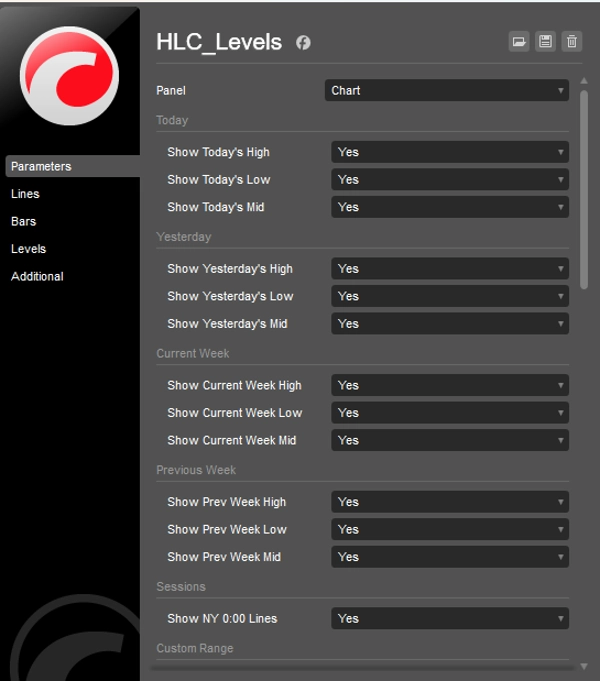
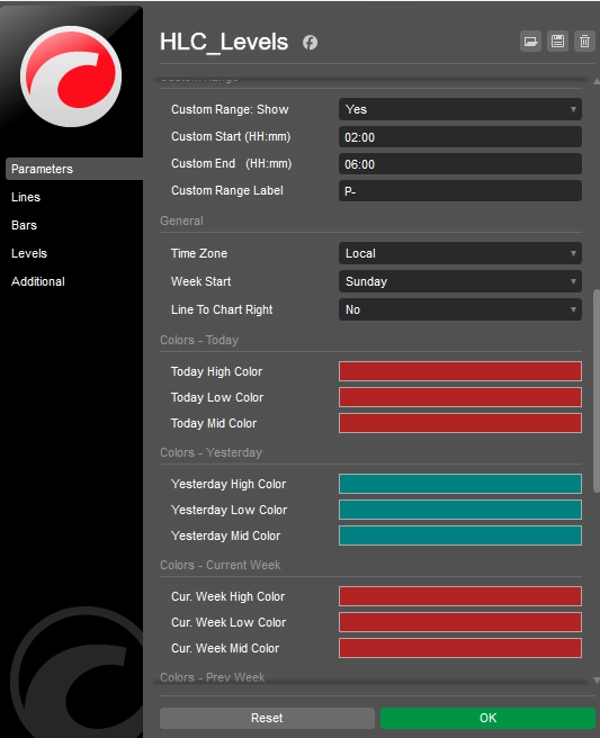
- 启用/禁用特定时间框架(今日、昨日、本周、上周)。
- 特定会话范围的自定义开始/结束时间。
- “延伸线”选项,用于将水平延伸到未来。
- 每组线条的自定义颜色。
摘要
AI 摘要
HLC_Levels is an advanced trading indicator designed to automate the plotting of key price levels based on High, Low, and Mid (50%) values across multiple timeframes. It supports daily and weekly levels, including today's and yesterday's ranges, as well as current and previous weeks. The indicator features a dedicated New York Midnight Open level, important for institutional traders focusing on directional bias.
Users can define custom time ranges or sessions (e.g., Asia Session, London Open, Initial Balance) to display corresponding High, Low, and Mid levels. A volatility dashboard provides on-chart pip range data for selected periods, enhancing market analysis. The tool adapts to various time zones, including Broker time, UTC, New York, or Local time, ensuring alignment with individual trading strategies.
Key functionalities include automatic level plotting to replace manual line drawing, customizable display options (line visibility, colors, styles, labels), and the ability to extend lines into the future. The indicator is suited for traders employing Price Action, ICT concepts, Smart Money Concepts (SMC), breakout, and scalping strategies across markets such as Forex, indices, and commodities like XAUUSD.
HLC_Levels helps identify reaction points where past highs, lows, and midpoints act as support or resistance, and highlights equilibrium pricing zones for better trade decision-making.
Users can define custom time ranges or sessions (e.g., Asia Session, London Open, Initial Balance) to display corresponding High, Low, and Mid levels. A volatility dashboard provides on-chart pip range data for selected periods, enhancing market analysis. The tool adapts to various time zones, including Broker time, UTC, New York, or Local time, ensuring alignment with individual trading strategies.
Key functionalities include automatic level plotting to replace manual line drawing, customizable display options (line visibility, colors, styles, labels), and the ability to extend lines into the future. The indicator is suited for traders employing Price Action, ICT concepts, Smart Money Concepts (SMC), breakout, and scalping strategies across markets such as Forex, indices, and commodities like XAUUSD.
HLC_Levels helps identify reaction points where past highs, lows, and midpoints act as support or resistance, and highlights equilibrium pricing zones for better trade decision-making.
指标配置
客户评价
4.5
评价:4
5 | 50 % | |
4 | 50 % | |
3 | 0 % | |
2 | 0 % | |
1 | 0 % |
客户评价
May 16, 2026
Bit weird to see there is no Close level eventhough it's called HLC_levels.. There is a high and low and a mid, but no close. I kinda find it essential to have a close though. Other than that is safes me huge amount of time daily to not set all these levels manually. So besides the lack of the close level i still like this indicator. Would love to see a new version with the added close level as the name suggests
March 2, 2026
A 5 minute check should not become a 30 minute rabbit hole, and the entry needs one more reason to make sense.
February 21, 2026
most of the value comes from the decision gets a little more breathing room. The market context still matters.
February 17, 2026
Kinda useful when the chart is messy. The first run should stay small enough to be boring.
讨论
常见问答
Prop
Forex
Scalping
Indices
SMC
AI
XAUUSD
NAS100
USDJPY
cTrader Store 提供的所有产品,包括交易机器人、指标和插件,均由第三方开发者提供,仅供信息参考和技术访问之用。cTrader Store 并非经纪商,不提供投资建议、个人推荐或任何未来业绩保证。






























价格
32
销售
940
免费安装