الوصف
HCCC MTF - قناة مركبة لدورة هيرست (مجانية 100%)
نظرة عامة
الHCCC MTF (قناة مركبة لدورة هيرست) هو لوحة تحكم ومؤشر قناة متقدم ومتفاعل متعدد الأطر الزمنية (MTF). بناءً على نظريات الدورات لـ J.M. Hurst مع تقلبات ATR، يساعدك هذا الأداة على تحديد الاتجاه الحقيقي للسوق ونقاط التحول الدورية المثالية (القمم والقيعان) عبر أطر زمنية متعددة في نفس الوقت.
الثاني مخصص للتداول شبه الآلي مع https://ctrader.com/products/3618?u=cLogic
مهم: هذا المؤشر هو مجاني 100% للجميع. تم تطويره خصيصًا ليكون الرفيق البصري النهائي لـ "Follow The Trend XAU Edition" cBot.
بينما يمكنك استخدامه بشكل مثالي للتداول اليدوي، يتم إطلاق قوته الحقيقية عند استخدامه في إعداد شبه آلي: تستخدم لوحة HCCC لقراءة دورة الإطار الزمني الأعلى والزخم، ثم تقوم بتمكين Follow The Trend XAU Edition cBot لتنفيذ وإدارة الصفقات بدقة في ذلك الاتجاه.
الميزات الرئيسية
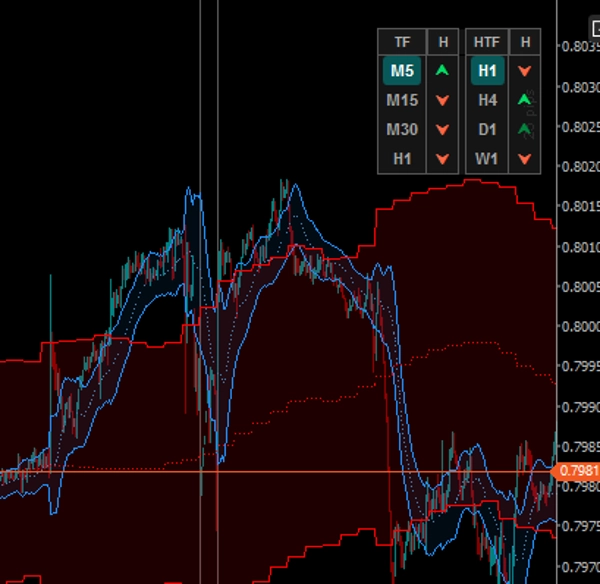
1. لوحة تحكم MTF تفاعلية (قابلة للنقر)
انسَ التبديل ذهابًا وإيابًا بين الرسوم البيانية. تتتبع لوحة التحكم على الرسم البياني 4 أطر زمنية أقل (LTF) و4 أطر زمنية أعلى (HTF).
- أزرار LTF: انقر على أي زر LTF لتغيير إطارك الزمني الحالي على الفور.
- أزرار HTF: انقر على أي زر HTF لعرض قناة ذلك الإطار الزمني الأعلى مباشرة على الرسم البياني الحالي!
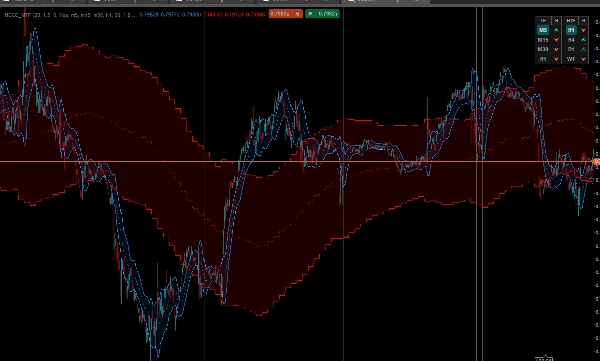
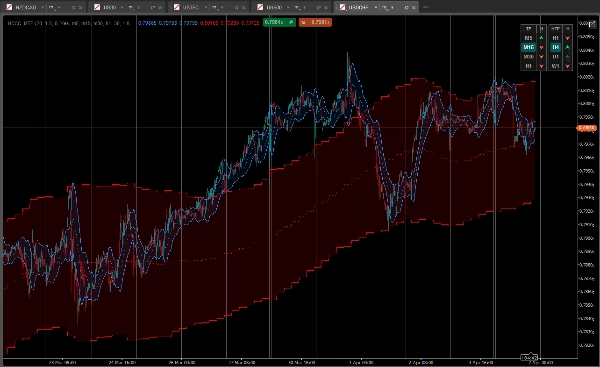
2. نظام تراكب القناة المزدوجة
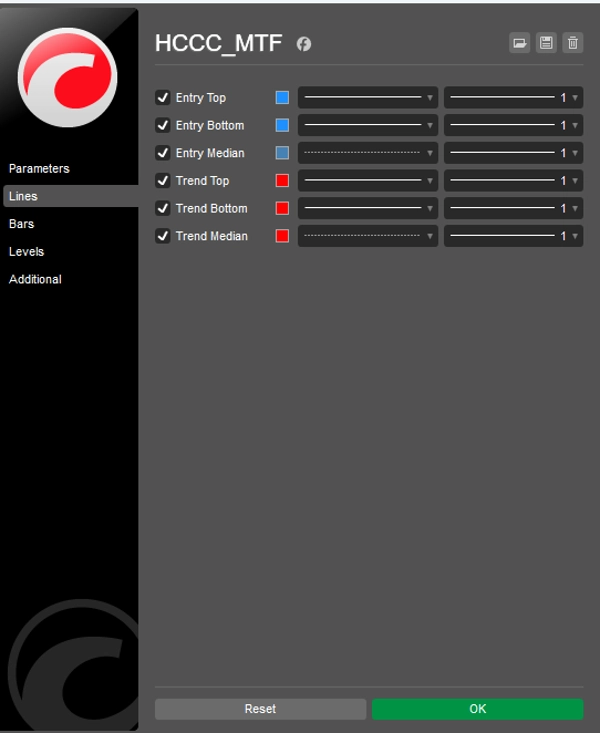
يرسم المؤشر قناتين أنيقتين مملوءتين بالسحب على الرسم البياني في نفس الوقت:
- دورة الدخول (السحابة الزرقاء): يحسب دورة هيرست بناءً على إطارك الزمني الحالي.
- دورة الاتجاه (السحابة الحمراء): قناة ذات رؤية كلية محسوبة من الإطار الزمني الأعلى الذي اخترته في لوحة التحكم.
3. إشارات دورية متقدمة بخمس حالات
لا تعرض لوحة التحكم اتجاه الاتجاه فقط؛ بل تعرض مرحلة الدورة من خلال تحليل ميل الخط المتوسط وموقع السعر بالنسبة لأشرطة ATR.
- [ ⮝ ] أخضر داكن (شراء قوي): ميل المتوسط صاعد، والسعر انخفض إلى الشريط السفلي. هذه قاع دوري (اشترِ عند الهبوط).
- [ ⮝ ] أخضر فاتح (شراء ضعيف): الاتجاه صاعد، لكن السعر يحوم حول المتوسط أو الشريط العلوي.
- [ — ] رمادي (محايد): الدورة مسطحة. لا يوجد زخم واضح.
- [ ⮟ ] أحمر فاتح (بيع ضعيف): الاتجاه هابط، لكن السعر قريب من المتوسط.
- [ ⮟ ] أحمر داكن (بيع قوي): ميل المتوسط هابط، والسعر ارتفع إلى الشريط العلوي. هذه قمة دورية (بع عند الارتفاع).
كيف تستخدمه مع cBot "Follow The Trend XAU Edition"؟
- انظر إلى الجانب الأيمن من لوحة التحكم (عمود HTF). انتظر توافقًا واضحًا على الأطر الزمنية الأعلى (مثلاً، H4 و D1 يظهران سهام خضراء داكنة/فاتحة).
- انظر إلى الجانب الأيسر من لوحة التحكم (عمود LTF) للعثور على ارتداد محلي (مثلاً، M15 يظهر سهم شراء قوي أخضر داكن).
- بمجرد توافق منطق MTF، قم بتفعيل cBot "Follow The Trend XAU Edition" في اتجاه "شراء" ودع خوارزمياته تتولى الدخول، وإيقاف الخسارة المتحرك، وإدارة المخاطر.
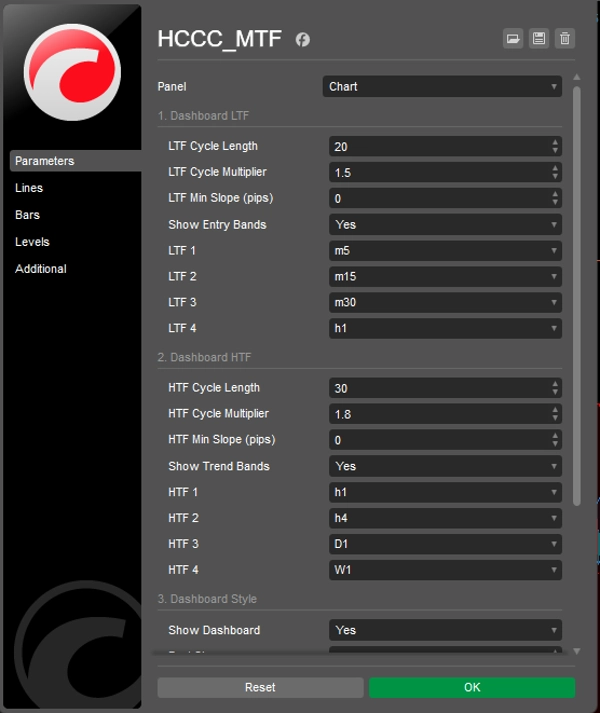
التخصيص
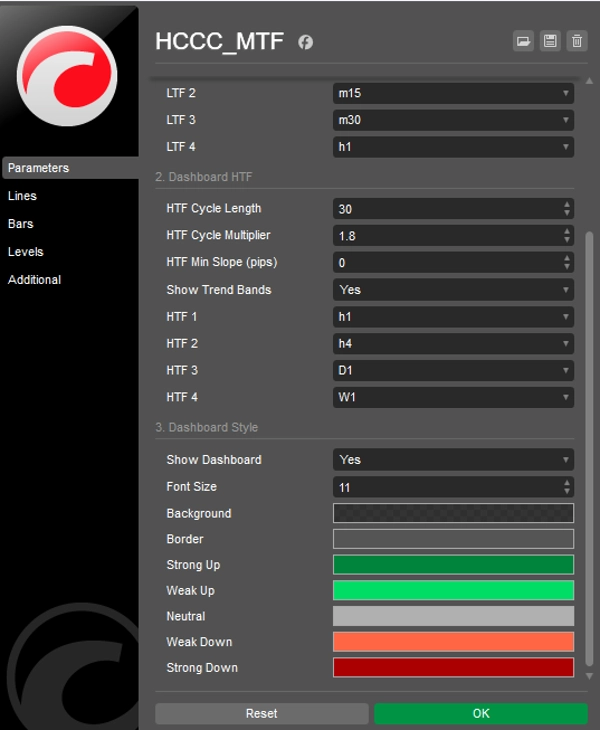
كل شيء قابل للتخصيص بالكامل: أطوال الدورات، مضاعفات ATR، حساسية الميل الأدنى (بالبِبْس) لتصفية الضوضاء، والتحكم الكامل في ألوان وموضع واجهة المستخدم.
قم بتحميله الآن مجانًا وارتقِ بتداولك شبه الآلي إلى المستوى التالي!
الملخص
It overlays two cloud-filled channels: a blue "Entry Cycle" channel based on the current timeframe and a red "Trend Cycle" channel derived from a selected higher timeframe. The dashboard provides advanced five-state cyclic signals indicating strong or weak buy/sell conditions and neutral phases by analyzing the slope of the median line and price position relative to ATR bands.
The indicator is fully customizable, including cycle lengths, ATR multipliers, slope sensitivity, and UI appearance. It is intended to complement the "Follow The Trend XAU Edition" cBot by providing visual cycle and momentum analysis to guide semi-automated trade execution and management. The HCCC MTF supports various markets including Forex, commodities, indices, stocks, and cryptocurrencies.