

说明
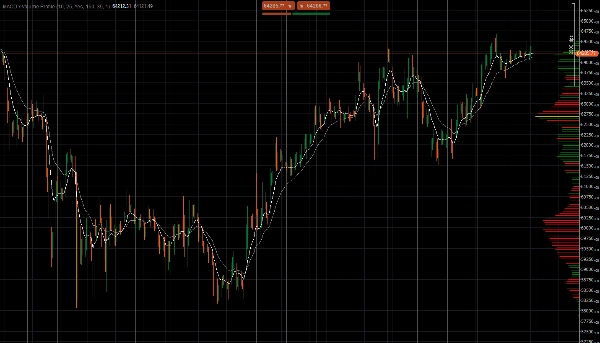
MACD x 交易量轮廓 是一个自定义的 cTrader (cAlgo) 叠加指标,旨在为交易者提供市场趋势和流动性的双重视角。通过结合 MACD 指标的基础元素和动态的交易量轮廓,它允许用户直接在主图表上分析动量以及历史价格接受区间。
主要特点:
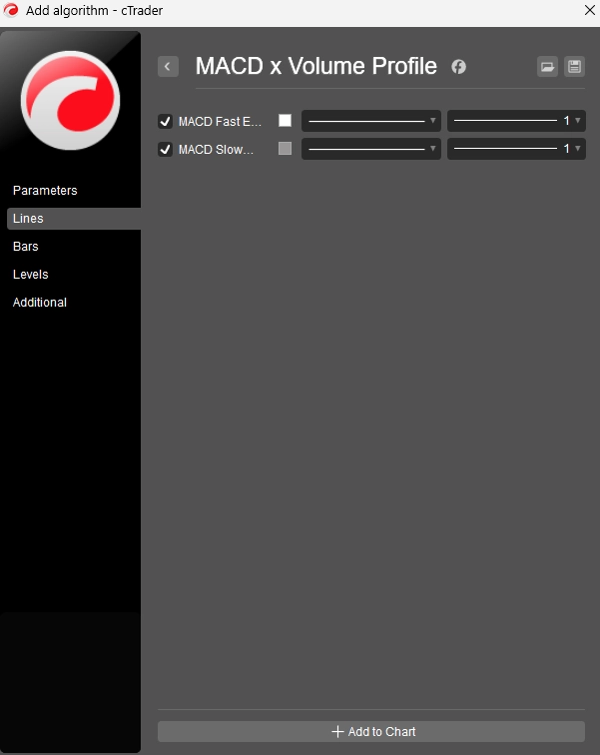
- 双指数移动平均线 (EMA): 在价格图表上直接显示快速 EMA(默认 10)和慢速 EMA(默认 25)。这些线的交叉和分离有助于识别短期和长期的趋势方向及动量,构成标准 MACD 分析的基础。
- 动态可见范围交易量轮廓 (VRVP): 指标动态计算并绘制基于当前图表上可见的柱状图的交易量轮廓。每当您滚动、缩放或调整图表窗口大小时,它会自动重新计算和调整。
- 控制点 (POC) 高亮显示: 以最高手交易量的价格水平(POC)用更粗的黄色线条明显标出,帮助您即时识别当前视图中最强的支撑或阻力区域。
- 方向性交易量着色: 交易量线条采用颜色编码以指示买卖压力。如果某价格区间在看涨蜡烛(收盘价 ≥ 开盘价)期间交易量较大,则轮廓线为绿色;如果看跌交易量占主导,则轮廓线为红色。
参数自定义:
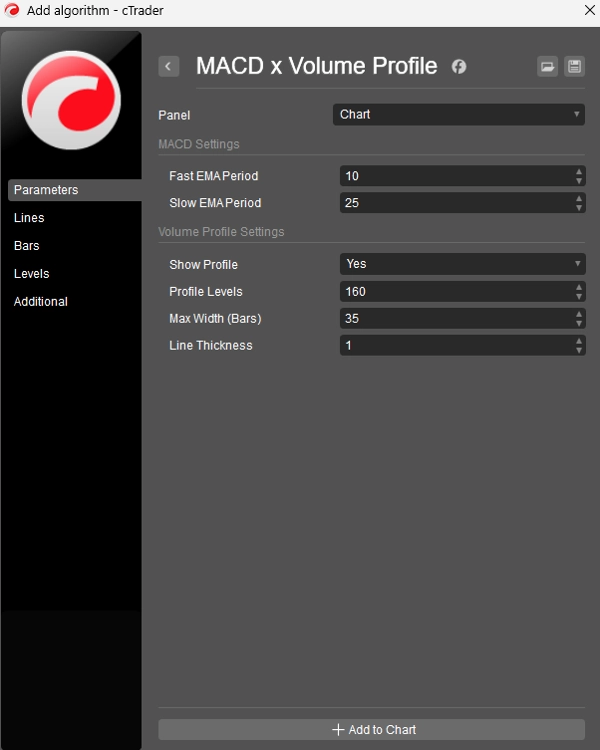
- MACD 设置: 快速和慢速 EMA 的周期均可完全调整。
- 轮廓粒度: 轮廓级别参数允许您调整交易量轮廓的分辨率(从 10 到 200 个价格区间)。
- 视觉调整: 用户可以切换轮廓的可见性,调整其在屏幕上的最大宽度,并调整线条粗细,以保持图表清晰并符合个人视觉偏好。
摘要
AI summary
The MACD x Volume Profile is a cTrader (cAlgo) overlay indicator that integrates the MACD's Fast and Slow Exponential Moving Averages (EMAs) with a dynamic Volume Profile on the main price chart. It displays a Fast EMA (default 10) and Slow EMA (default 25) to help identify trend direction and momentum through their crossings and separations. The Volume Profile dynamically calculates volume distribution based on the currently visible bars, updating automatically with chart navigation. The indicator highlights the Point of Control (POC)—the price level with the highest traded volume—using a distinct yellow line to mark key support or resistance zones. Volume bars are color-coded green or red to indicate buying or selling pressure, respectively. Users can customize MACD periods, adjust the granularity of the volume profile (10 to 200 price buckets), and modify visual settings such as profile visibility, width, and line thickness to suit their preferences. This tool combines momentum analysis with liquidity visualization to support trading decisions.
指标配置
指标分类
交易量
输出类型
可视化
数据要求
交易量
支持的信号
趋势强度
反转
客户评价
0.0
评价:0
客户评价
该产品尚无评价。已经试过了?抢先告诉其他人!
讨论
常见问答
EMA
Volume
MACD
Moving Average
cTrader Store 提供的所有产品,包括交易机器人、指标和插件,均由第三方开发者提供,仅供信息参考和技术访问之用。cTrader Store 并非经纪商,不提供投资建议、个人推荐或任何未来业绩保证。
该作者的其他作品





猜您喜欢

!["[Stellar Strategies] Smart ADX" 标识](https://cdn.ctrader.com/image/webp/af13b084-b6f6-41db-b7bc-c7e688b57b05_36929)







!["[Hamster-Coder] Pivot Points MTF" 标识](https://cdn.ctrader.com/image/webp/4c143e5a-309c-40e3-a578-f04d1e133ffa_31159)








价格
注册日期 21/02/2026
17.53M
交易量
2.85K
盈利点数
1
销售