
Açıklama
Price Jump Exit and Re-entry (PjER ) Göstergesi, akademik makaleye dayanan bir risk yönetimi göstergesidir “A dynamic price jump exit and reentry strategy for intraday trading” Koegelenberg & van Vuuren (2024) tarafından yazılmıştır, Expert Systems With Applications Journal'da yayımlanmıştır.
Ana Yenilik
- Olası kayıpların gerçekleşmeden önceki VaR tahminleri
- Kısa zaman dilimlerinde güçlü piyasa trendlerine karşı dayanıklılık
- Güvenli yeniden giriş zamanlaması için sıçrama sonrası piyasa düzeltme analizi
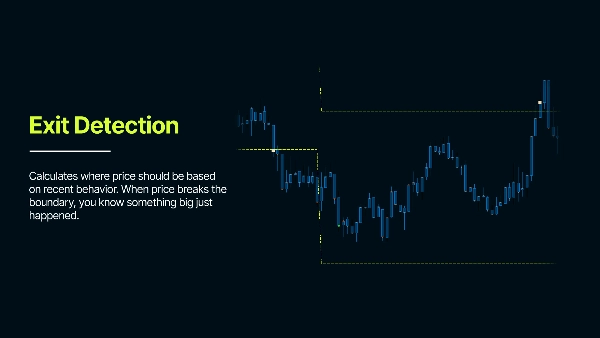
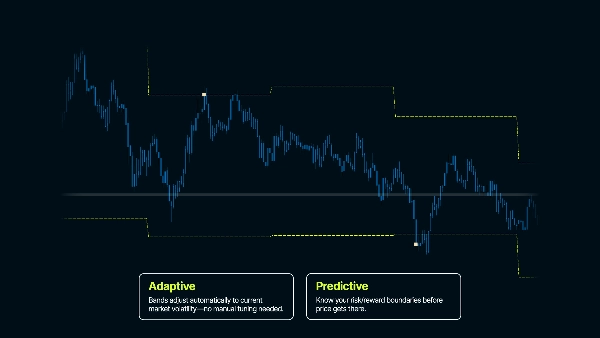
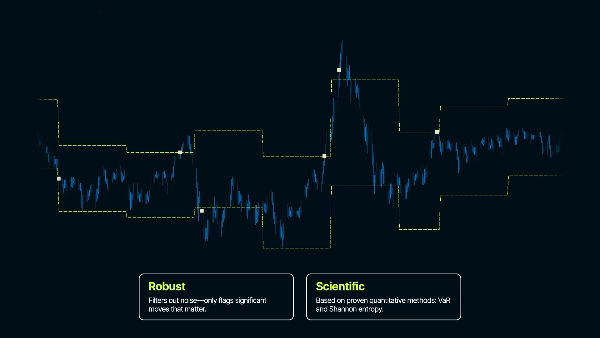
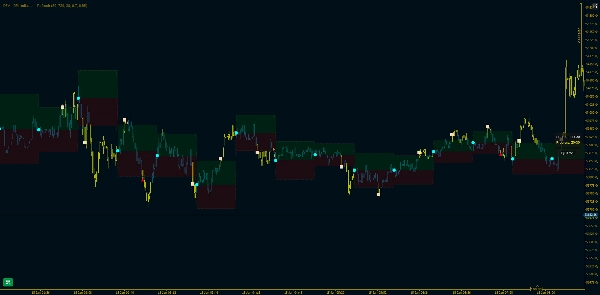
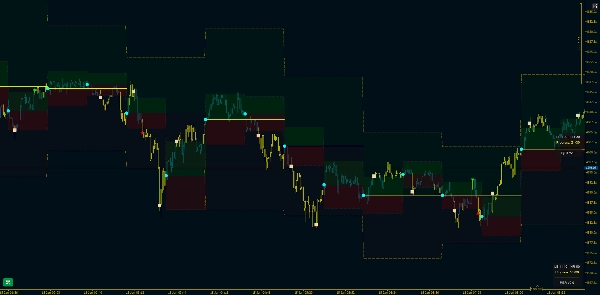
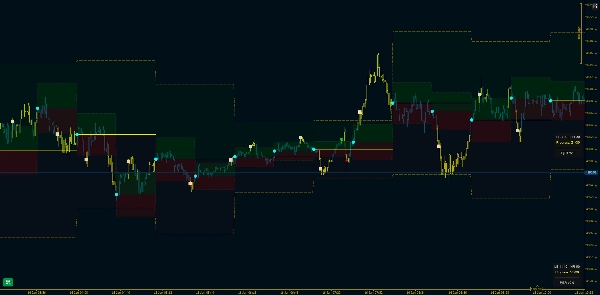
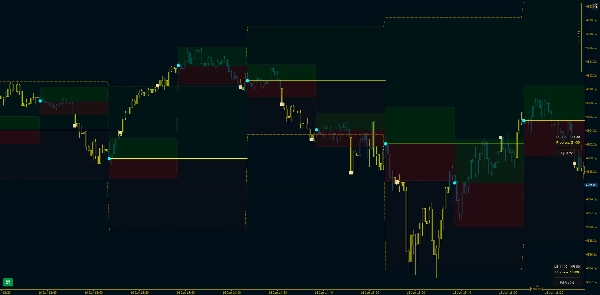
Geçmiş fiyat hareketlerini analiz ederek tipik volatiliteyi anlar ve beklenen fiyat aralığını temsil eden Güven Aralıkları oluşturur. Fiyat bu bantların dışına sıçradığında, anormal bir durumun gerçekleştiğini işaret eder.
Hedef Kullanım Durumu
Gün içi işlemler (özellikle aralık bazlı stratejiler). Bu gösterge, fiyat etrafında istatistiksel sınırlar oluşturarak anormal fiyat hareketlerini tespit eder. Normal piyasa davranışında fiyat, son volatiliteye dayalı beklenen aralıklar içinde kalır. Fiyat bu bantları kırdığında, piyasa davranışının değiştiğini gösteren alışılmadık bir durumun gerçekleştiğini işaret eder - bu, işlemden çıkış noktası veya piyasa yapısında bir kırılma olabilir.
Temel Parametreler Açıklaması
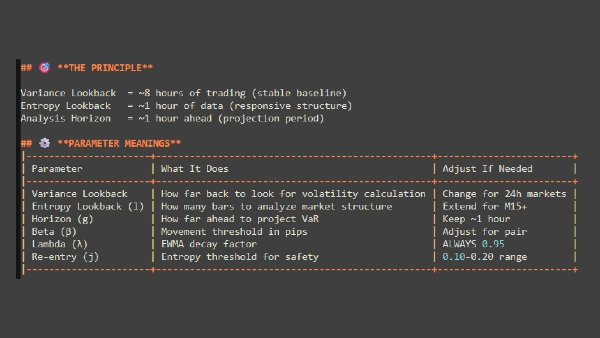
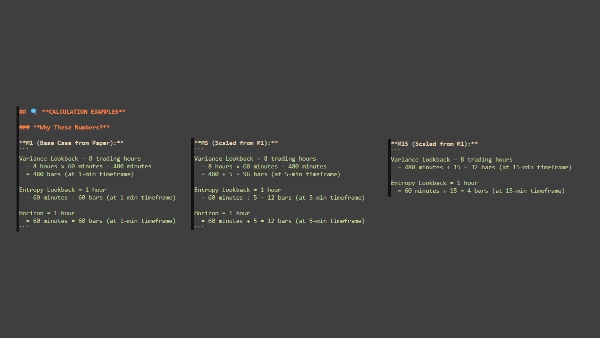
Maksimum Geriye Dönük Gün Sayısı - Göstergenin geçmişte ne kadar geriye giderek çalışmaya başlayacağını belirler
GMT Ofseti - Zaman diliminize göre ayarlar. Tarih hesaplamalarının yerel zamanınızla uyumlu olmasını sağlar
Geriye Bakış Dönemi (çubuklar)
"‘Normal’ davranışı ölçmek için ne kadar fiyat geçmişi kullanmalıyım?"
- Volatilite hesaplamak için kaç çubukluk geçmiş veri kullanılacağı
- Daha fazla çubuk = daha stabil ama uyum daha yavaş; daha az çubuk = daha hızlı tepki ama daha gürültülü
- Örnek: M1’de 1440 çubuk = 24 saatlik veri
Analiz Ufku (çubuklar)
"Yeniden başlamadan önce fiyatı ne kadar süre izlemeliyim?"
- Bantların sıfırlanmadan önce her analiz döneminin ne kadar sürdüğü
- Analiz ettiğiniz zaman dilimini belirler - daha kısa = daha sık sıfırlama, daha uzun = bantlar daha uzun süre sabit kalır
- Örnek: 60 çubuk = bantlar 60 çubuk boyunca kalır, sonra yeni referans fiyatından yeniden hesaplanır
Risk Olasılığı
"Fiyatın normalde bu seviyelere ulaşmayacağından ne kadar emin olmak istiyorum?"
- Bantlar için güven seviyesini belirler (bir güvenlik marjı gibi)
- Daha yüksek değerler = daha geniş bantlar (daha az sinyal), daha düşük değerler = daha sıkı bantlar (daha fazla sinyal)
- Örnek: 0.80 = fiyatın normal koşullar altında bantlar içinde kalacağına %80 güven
Azalma Faktörü (λ - Lambda)
"Daha çok yakın zamanda olanlara mı önem vermeliyim yoksa tüm geçmişi eşit mi değerlendirmeliyim?"
- Volatilite hesaplamalarında yakın veriye karşı eski veriye ne kadar ağırlık verileceğini kontrol eder
- Daha yüksek değerler = yakın veri daha önemli; daha düşük değerler = tüm veriler daha eşit ağırlıklı
- Örnek 0.95 = yakın volatilite hesaplamayı güçlü şekilde etkiler
HATIRLANMASI GEREKEN ANA NOKTALAR
Bu bir RİSK YÖNETİMİ aracıdır – Volatilite olaylarını ve zaman içindeki stabiliteyi tanımlar
Güven Aralıkları kritik önemdedir – Bantlar ATR gibi fiyatı takip etmemelidir – Bantlar her analiz dönemi için hesaplanır
Yeniden giriş sabır gerektirir – Çıkıştan hemen sonra yeniden giriş beklemeyin – Piyasanın stabil hale gelmesi gerekir
Parametreler varlık ve zaman dilimine özgüdür – Varsayılan parametreler başlangıç noktalarıdır – Piyasa ve stilinize göre optimize edin – FX’te işe yarayan parametreler Endeksler, Metaller veya Kripto için işe yaramayabilir.
( * ) Bu gösterge yalnızca eğitim ve bilgilendirme amaçlıdır. Finansal veya yatırım tavsiyesi olarak kullanılmaz. Bu ürün, belgeleri veya ilgili materyallerde yer alan hiçbir şey, herhangi bir finansal enstrümanı alım, satım veya elde tutma tavsiyesi olarak yorumlanmamalıdır. Finansal piyasalarda işlem yapmak önemli riskler içerir ve tüm yatırımcılar için uygun olmayabilir. Geçmiş performans gelecekteki sonuçların göstergesi değildir. Kar garantisi yoktur ve kullanıcılar önemli kayıplar yaşayabilir. Bu göstergenin kullanımıyla, kendi ticaret kararlarınızdan ve finansal sonuçlarınızdan tamamen sorumlu olduğunuzu kabul etmiş olursunuz. Bu ürünün yaratıcısı, doğrudan veya dolaylı olarak kullanımından kaynaklanan herhangi bir zarar veya kayıptan sorumlu tutulamaz. Her zaman kendi analizlerinizi yaparak ticaret kararlarınızı verin.
Özet
Key features include Value at Risk (VaR) estimates to anticipate potential losses, robustness against strong short-term trends, and analysis of post-jump corrections to identify safe re-entry timings. Core adjustable parameters allow users to tailor the indicator to specific assets and timeframes, including lookback period for volatility calculation, analysis horizon for band recalculation frequency, risk probability to set confidence levels, and decay factor to weight recent versus older data.
The indicator emphasizes patience for re-entry after exits, as market stabilization is required. It is intended as a tool for identifying volatility events and managing risk rather than providing direct trade signals. Users should optimize parameters according to their trading style and market conditions.
Müşteri değerlendirmeleri
5 | 100 % | |
4 | 0 % | |
3 | 0 % | |
2 | 0 % | |
1 | 0 % |


