
Half Trend BT
Indikator
38 pembelian
Versi 1.0, Mar 2025
Windows, Mac
4.3
Ulasan: 3
Penerangan
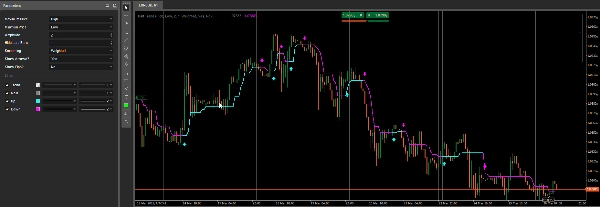
Penunjuk Half Trend direka untuk mengesan dan menyerlahkan kemungkinan pembalikan tren dengan membandingkan paras tinggi dan rendah terkini sepanjang tempoh yang ditetapkan, kemudian melukis garis “Naik” atau “Turun” mengikutnya. Ia secara pilihan melukis anak panah pada setiap perubahan tren dan boleh memaparkan perbezaan pip antara isyarat.
- Pemilihan Siri Tinggi/Rendah
- Penunjuk menggunakan dua siri harga (Tinggi dan Rendah secara lalai) untuk menjejaki maksimum dan minimum tempatan.
- Anda boleh memilih jenis harga yang berbeza (contohnya,
Buka,Tutup,Median, dan lain-lain) untuk setiap siri melalui Harga Maksimum dan Harga Minimum.
- Purata Pergerakan & Pengiraan Tempoh
- Purata pergerakan (berdasarkan jenis Pelicinan yang dipilih dan tempoh Amplitud) digunakan pada kedua-dua siri harga “tinggi” dan “rendah” yang dipilih.
- Penunjuk membandingkan harga bar semasa dengan paras tinggi/rendah yang dilicinkan ini untuk memutuskan sama ada untuk beralih dari tren menaik ke tren menurun (atau sebaliknya).
- Pengesanan & Lukisan Tren
- Jika penunjuk mengenal pasti tren menaik, ia melukis garis Naik (sian) dan menetapkan
Trendkepada+1. - Jika ia mengesan tren menurun, ia melukis garis Turun (magenta) dan menetapkan
Trendkepada-1. - Output Utama (kelabu) dikemas kini secara dalaman untuk mencerminkan paras sokongan/rintangan semasa.
Trendadalah siri output tidak kelihatan yang menyimpan arah tren secara berangka (+1atau-1).
- Jika penunjuk mengenal pasti tren menaik, ia melukis garis Naik (sian) dan menetapkan
- Anak Panah & Pengiraan Pip
- Tunjukkan Anak Panah? – Jika diaktifkan, penunjuk melukis anak panah pada setiap bar baru di mana pembalikan tren dikesan.
- Tunjukkan Pip? – Jika diaktifkan, ia mengira dan memaparkan perbezaan pip antara isyarat terakhir dan isyarat baru, melukis label kecil dan garisan tren pada carta.
Ringkasan
Ringkasan AI
The Half Trend BT indicator detects potential trend reversals by analyzing recent highs and lows over a specified period. It compares two selected price series—typically High and Low, but configurable to other price types such as Open, Close, or Median—using moving averages based on chosen smoothing methods and amplitude periods. The indicator plots an "Up" line (cyan) when an uptrend is detected and a "Down" line (magenta) for a downtrend, while internally storing trend direction numerically (+1 or -1). A main output line (gray) reflects current support and resistance levels. Optional features include drawing arrows on bars where trend reversals occur and calculating pip differences between signals, which are displayed as labels and trendlines on the chart. This indicator supports multiple markets including Forex, indices, commodities, cryptocurrencies, and stocks.
Profil indikator
Ulasan pelanggan
4.3
Ulasan: 3
5 | 33 % | |
4 | 67 % | |
3 | 0 % | |
2 | 0 % | |
1 | 0 % |
Ulasan pelanggan
March 29, 2025
Clean idea for traders around chart reading. The useful part is adding confirmation before a trade, with the numbers checked before scaling. The cleaner reads should hold across 3 sessions, not just 1 good chart. It is stronger when a 1.5R target is realistic before the entry.
March 28, 2025
March 28, 2025
Decent tool for testing if the trader wants it makes market context easier to scan. It works best as support, not a final decision maker. I would test it on 2 timeframes, 20 signals and a 1R stop plan. it should not be used as a blind entry trigger.
Perbincangan
Soalan Lazim
Prop
Forex
Signal
Indices
Commodities
Crypto
Stocks
Produk yang tersedia melalui cTrader Store, termasuk bot dagangan, indikator dan plugin, disediakan oleh pembangun pihak ketiga dan diberikan akses untuk tujuan maklumat dan teknikal sahaja. cTrader Store bukan broker dan tidak memberikan nasihat pelaburan, syor peribadi atau sebarang jaminan prestasi masa hadapan.


![Logo "[Stellar Strategies] Smart ADX"](https://cdn.ctrader.com/image/webp/af13b084-b6f6-41db-b7bc-c7e688b57b05_36929)


Harga
48
Jualan
1.05K
Pemasangan percuma