
Volume Profile Triple Line - POC Median Mode
Indikator
4 pembelian
Versi 1.0, Feb 2025
Windows, Mac
4.0
Ulasan: 2
Penerangan
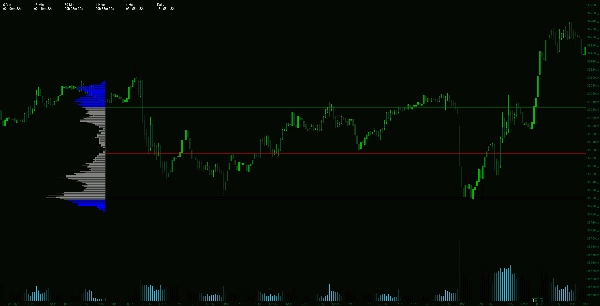
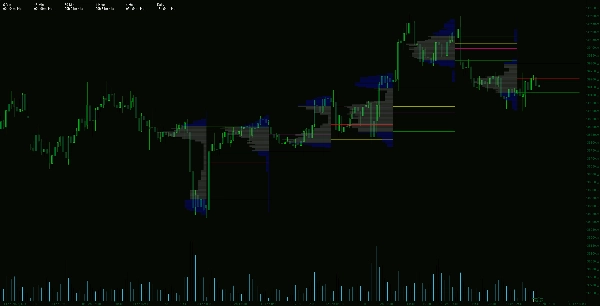
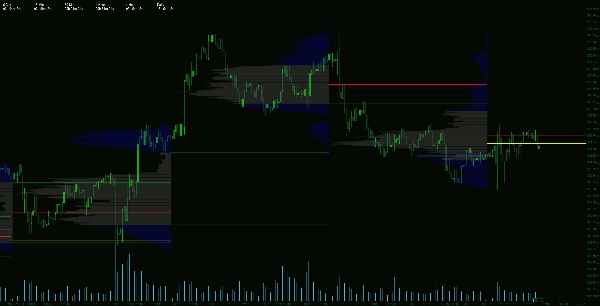
Penunjuk Profil Isipadu Lanjutan adalah alat perdagangan profesional yang direka untuk memberikan wawasan mendalam pasaran melalui analisis isipadu. Ia mengira Titik Kawalan (POC), Median, dan Mod, menawarkan pandangan tepat tentang tahap harga di mana aktiviti pasaran yang signifikan berlaku.
Ciri-ciri Utama:
Ringkasan
Ringkasan AI
The Advanced Volume Profile Indicator is a professional trading tool that analyzes market volume to identify key price levels. It calculates the Point of Control (POC), Median, and Mode, highlighting price points with the highest traded volume and providing statistical insights into price balance and trend strength. The indicator displays the previous day's volume distribution and volume curve, then projects key levels such as Value Area High (VAH), Value Area Low (VAL), POC, Median, and Mode onto the following day. This helps traders identify support and resistance zones, volume gaps, and areas of accumulation or distribution. By leveraging volume-based data, users can refine trade entries, exits, and stop-loss placements for improved market positioning. The indicator requires significant memory resources due to its detailed volume distribution calculations.
Profil indikator
Ulasan pelanggan
4.0
Ulasan: 2
5 | 0 % | |
4 | 100 % | |
3 | 0 % | |
2 | 0 % | |
1 | 0 % |
Ulasan pelanggan
February 26, 2025
A few ugly trades are useful in the sample, and the log becomes easier to read.
February 20, 2025
It becomes more useful when fewer random clicks reach the trade log, and 20 reactions is a fair first sample.
Perbincangan
Soalan Lazim
Produk yang tersedia melalui cTrader Store, termasuk bot dagangan, indikator dan plugin, disediakan oleh pembangun pihak ketiga dan diberikan akses untuk tujuan maklumat dan teknikal sahaja. cTrader Store bukan broker dan tidak memberikan nasihat pelaburan, syor peribadi atau sebarang jaminan prestasi masa hadapan.


Harga
Sejak 14/01/2025
55
Jualan
11.51K
Pemasangan percuma