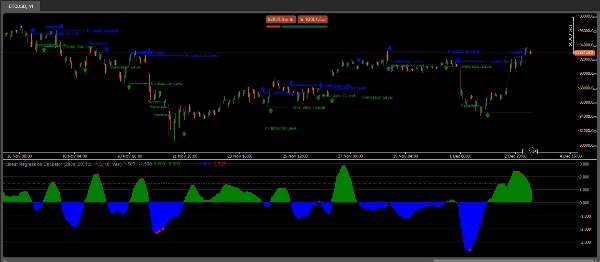
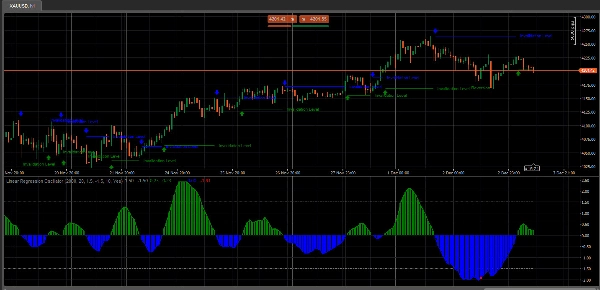
The Linear Regression Oscillator (LRO) adalah penunjuk teknikal yang berdasarkan analisis regresi linear, yang biasa digunakan dalam pasaran kewangan untuk menilai momentum dan arah tren harga. Ia mengukur jarak antara harga semasa dan nilai yang diramalkan oleh garis regresi linear, yang pada dasarnya adalah garis kesesuaian terbaik sepanjang tempoh tertentu. Berikut adalah pecahan bagaimana ia berfungsi dan komponennya:
Komponen Utama Linear Regression Oscillator
- Garis Regresi Linear (Garis Kesesuaian Terbaik): Garis ini mewakili pergerakan harga yang dijangka sepanjang tempoh tertentu dan dikira menggunakan teknik regresi linear. Cerun garis menunjukkan arah tren: cerun positif mencadangkan tren menaik, manakala cerun negatif menunjukkan tren menurun.
- Nilai Oscillator: Nilai oscillator dikira dengan mengukur penyimpangan antara harga semasa dan garis regresi linear. Penyimpangan ini diplot sebagai nilai oscillator, biasanya berayun di sekitar garis sifar.
- Garis Sifar: Garis sifar dalam plot LRO bertindak sebagai garis asas. Apabila nilai oscillator melintasi di atas garis sifar, ia mencadangkan momentum bullish, dan lintasan di bawah mencadangkan momentum bearish.
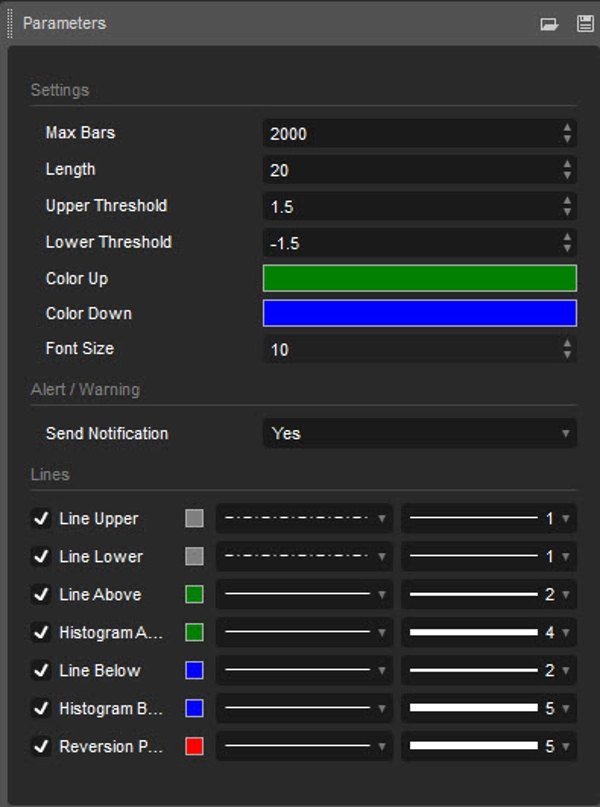
- Tetapan dan Tempoh: Tetapan tempoh menentukan bilangan bar atau titik data yang diambil kira untuk mengira garis regresi linear. Pedagang menyesuaikan tetapan ini untuk strategi perdagangan jangka pendek atau jangka panjang, bergantung pada jangka masa analisis pilihan mereka.
Bagaimana Pedagang Menggunakan Linear Regression Oscillator
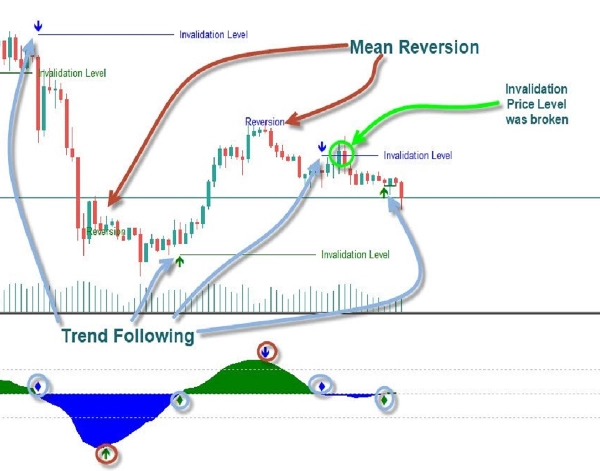
- Mengenal Pasti Tren: LRO membantu pedagang melihat jika tren harga semasa mempunyai momentum dengan menunjukkan jarak relatif antara harga dan garis (regresi) yang dijangkakan.
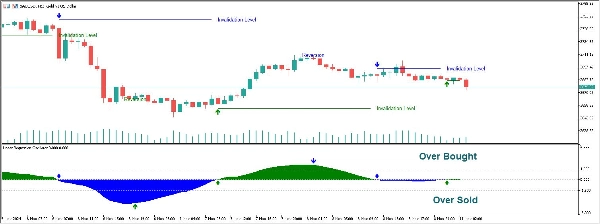
- Tahap Jual Beli Berlebihan: Nilai ekstrem dalam oscillator boleh menunjukkan keadaan beli berlebihan atau jual berlebihan, mencadangkan kemungkinan pembalikan atau keperluan untuk menyesuaikan posisi.
- Isyarat Divergensi: Apabila pergerakan harga dan penunjuk LRO berbeza, ia boleh memberi isyarat momentum yang melemah atau kemungkinan pembalikan.
Petua Tafsiran
- Melintasi Garis Sifar: Lintasan di atas sifar mungkin menunjukkan tren menaik yang muncul, manakala lintasan di bawah sifar mencadangkan tren menurun.
- Menyesuaikan Tempoh: Tempoh yang lebih pendek menjadikan LRO lebih sensitif, menangkap pergerakan harga yang cepat tetapi meningkatkan bunyi. Tempoh yang lebih panjang melicinkan turun naik, sesuai untuk mengenal pasti tren jangka panjang.
Nota Penggunaan:
- Panjang: Menentukan tempoh di mana regresi linear dikira
- Ambang Atas/Bawah: Menentukan had atas dan bawah untuk mengenal pasti keadaan beli berlebihan dan jual berlebihan. Nilai di luar ambang ini mencadangkan kemungkinan pembalikan.
Linear Regression Oscillator dihargai kerana menggabungkan analisis statistik dengan prinsip mengikuti tren, menjadikannya alat serbaguna untuk pedagang momentum dan tren. Ia sangat berguna dalam pasaran tren di mana ia membantu mengenal pasti kesinambungan tren atau pembalikan berdasarkan penyimpangan dari garis tren regresi.
5 | 0 % | |
4 | 100 % | |
3 | 0 % | |
2 | 0 % | |
1 | 0 % |