
Penerangan
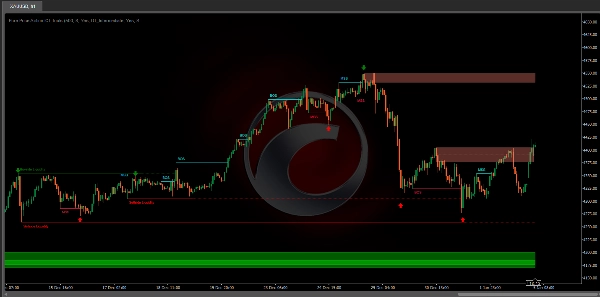
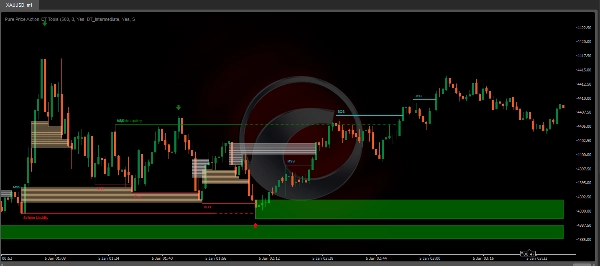
Penunjuk Pure Price Action ICT Tools direka untuk analisis tindakan harga tulen, secara automatik mengenal pasti struktur pasaran masa nyata, tahap kecairan, blok pesanan & pemecah, dan kekosongan kecairan.
Ciri uniknya terletak pada kebergantungan eksklusif pada corak harga, tanpa terikat oleh sebarang input yang ditentukan pengguna, memastikan analisis dinamik pasaran yang kukuh dan objektif.
Ciri Utama
- Struktur Pasaran
Peralihan Struktur Pasaran, juga dikenali sebagai Perubahan Watak (CHoCH), adalah peristiwa penting dalam analisis tindakan harga yang menunjukkan kemungkinan perubahan sentimen atau arah pasaran. MSS berlaku apabila harga berbalik dari tren yang telah ditetapkan, menandakan bahawa tren yang sedang berlaku mungkin kehilangan momentum dan pembalikan mungkin sedang berlaku. Peralihan ini sering dikenalpasti oleh corak teknikal utama, seperti rendah yang lebih tinggi dalam tren menurun atau tinggi yang lebih rendah dalam tren menaik, yang menunjukkan kelemahan kekuatan tren semasa.
Pecahan Struktur biasanya menunjukkan kesinambungan tren pasaran semasa. Peristiwa ini berlaku apabila harga bergerak dengan tegas melepasi tinggi atau rendah ayunan sebelumnya, mengesahkan kekuatan tren yang sedang berlaku. Dalam tren menaik, BOS ditandai dengan harga yang memecah di atas tinggi sebelumnya, manakala dalam tren menurun, ia dikenalpasti dengan harga yang memecah di bawah rendah sebelumnya.
Walaupun Peralihan Struktur Pasaran (MSS) boleh menunjukkan kemungkinan pembalikan tren dan Pecahan Struktur (BOS) sering mengesahkan kesinambungan tren, ia tidak menjamin pembalikan atau kesinambungan sepenuhnya. Tahap MSS dan BOS juga boleh berfungsi sebagai zon kecairan atau kawasan pengukuhan harga dan bukan secara pasti menandakan perubahan arah pasaran. Pedagang harus mendekati isyarat ini dengan berhati-hati dan mengesahkannya dengan faktor tambahan sebelum membuat keputusan perdagangan. Untuk maklumat lanjut mengenai komponen lain alat ini, sila rujuk bahagian berikut.
- Blok Pesanan & Pemecah
Blok Pesanan dan Pemecah adalah konsep utama dalam analisis tindakan harga yang membantu pedagang mengenal pasti tahap penting dalam struktur pasaran.
Blok Pesanan adalah zon harga tertentu di mana aktiviti pembelian atau penjualan yang signifikan telah berlaku. Zon ini sering mewakili tindakan pedagang institusi besar atau pembuat pasaran, yang melaksanakan pesanan besar yang memberi kesan kepada pasaran.
Blok Pemecah adalah zon harga tertentu di mana berlaku pembalikan kuat, menyebabkan pecahan dalam struktur pasaran yang sedang berlaku. Blok ini menunjukkan kawasan di mana harga menghadapi rintangan atau sokongan yang signifikan, membawa kepada pembalikan.
Secara ringkas, kecairan sisi beli dan sisi jual memberikan pandangan penting mengenai dinamik permintaan dan penawaran pasaran, membantu pedagang membuat keputusan yang berinformasi berdasarkan ketersediaan pesanan pada tahap harga yang berbeza.
- Kecairan Sisi Beli & Sisi Jual
Kedua-dua zon kecairan sisi beli dan sisi jual adalah kritikal untuk mengenal pasti titik perubahan potensi dalam pasaran. Zon ini adalah tempat tumpuan minat pembelian atau penjualan yang signifikan, mempengaruhi pergerakan harga masa depan.
Secara ringkas, kecairan sisi beli dan sisi jual memberikan pandangan penting mengenai dinamik permintaan dan penawaran pasaran, membantu pedagang membuat keputusan yang berinformasi berdasarkan ketersediaan pesanan pada tahap harga yang berbeza.
- Kekosongan Kecairan
Kekosongan kecairan adalah jurang atau kawasan pada carta harga di mana terdapat kekurangan aktiviti perdagangan. Kekosongan ini mewakili zon dengan pesanan beli atau jual yang minimum hingga tiada, sering mengakibatkan pergerakan harga yang tajam apabila pasaran memasuki kawasan ini.
Secara ringkas, kekosongan kecairan adalah kawasan penting pada carta harga yang dicirikan oleh kekurangan aktiviti perdagangan. Kekosongan ini boleh menyebabkan pergerakan harga yang cepat dan peningkatan volatiliti, menjadikannya pertimbangan penting bagi pedagang dalam analisis dan proses membuat keputusan mereka.
- Titik Ayunan
Titik harga pembalikan biasanya dirujuk sebagai titik ayunan. Pedagang sering menganalisis titik ayunan sejarah untuk mengenal pasti tren pasaran dan menentukan titik masuk dan keluar perdagangan yang berpotensi.
Perlu diingat bahawa dalam skrip ini, titik-titik ini tertakluk kepada lukisan semula, iaitu mereka tidak terletak di tempat mereka dikesan.
Pengesanan titik ayunan dan ciri unik skrip ini bergantung sepenuhnya pada tindakan harga, menghapuskan keperluan untuk tetapan berangka yang ditentukan pengguna. Proses bermula dengan mengesan titik ayunan jangka pendek:
- Ayunan Tinggi Jangka Pendek (STH): Dikenal pasti sebagai puncak harga yang dikelilingi oleh tinggi yang lebih rendah di kedua-dua sisi.
- Ayunan Rendah Jangka Pendek (STL): Dikenal pasti sebagai lembah harga yang dikelilingi oleh rendah yang lebih tinggi di kedua-dua sisi.
Titik ayunan jangka sederhana dan jangka panjang dikesan menggunakan pendekatan yang sama tetapi dengan sedikit pengubahsuaian. Daripada menganalisis lilin harga secara langsung, titik ayunan jangka pendek yang telah dikesan sebelumnya digunakan. Untuk titik ayunan jangka sederhana, titik ayunan jangka pendek dianalisis, manakala untuk titik ayunan jangka panjang, titik jangka sederhana digunakan.
Kaedah ini memastikan analisis dinamik pasaran yang kukuh dan objektif, menawarkan pedagang pandangan yang boleh dipercayai mengenai struktur pasaran. Titik ayunan yang dikesan berfungsi sebagai asas untuk mengenal pasti struktur pasaran, tahap kecairan sisi beli/sisi jual, dan blok pesanan serta pemecah yang dibentangkan dengan alat ini.
Secara ringkas, titik ayunan adalah elemen penting dalam analisis teknikal, membantu pedagang mengenal pasti tren, tahap sokongan dan rintangan, serta titik masuk dan keluar yang optimum. Memahami titik ayunan membolehkan pedagang membuat keputusan yang berinformasi berdasarkan pergerakan harga semula jadi dalam pasaran.
Tetapan
- Struktur Pasaran
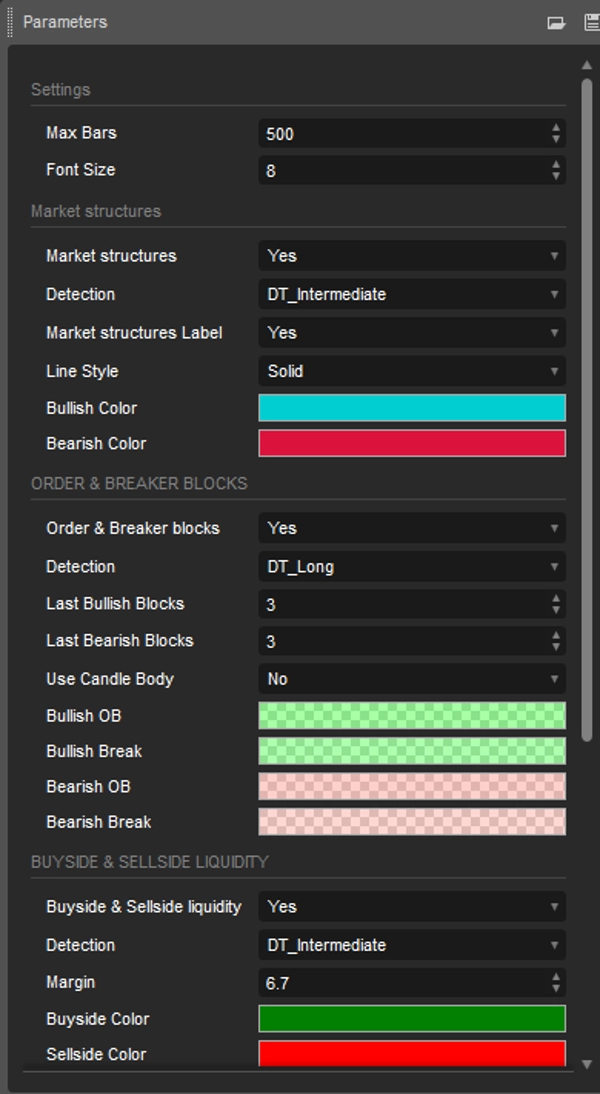
Struktur Pasaran: Menghidupkan atau mematikan keterlihatan struktur pasaran, termasuk peralihan dan pecahan.
Pengesanan: Pilihan yang membolehkan pengguna mengesan struktur pasaran berdasarkan kepentingan tahap ayunan, termasuk jangka pendek, jangka sederhana, dan jangka panjang.
Label Struktur Pasaran: Mengawal keterlihatan label yang menonjolkan jenis struktur pasaran.
Gaya Garis: Menyesuaikan gaya garis yang mewakili struktur pasaran.
- Blok Pesanan & Pemecah
Blok Pesanan & Pemecah: Menghidupkan atau mematikan keterlihatan blok pesanan & pemecah.
Pengesanan: Pilihan yang membolehkan pengguna mengesan blok pesanan & pemecah berdasarkan kepentingan tahap ayunan, termasuk jangka pendek, jangka sederhana, dan jangka panjang.
Blok Bullish Terakhir: Bilangan blok pesanan/pemecah bullish terkini yang dipaparkan pada carta.
Blok Bearish Terakhir: Bilangan blok pesanan/pemecah bearish terkini yang dipaparkan pada carta.
Gunakan Badan Lilin: Membolehkan pengguna menggunakan badan lilin sebagai kawasan blok pesanan dan bukannya julat lilin penuh.
- Kecairan Sisi Beli & Sisi Jual
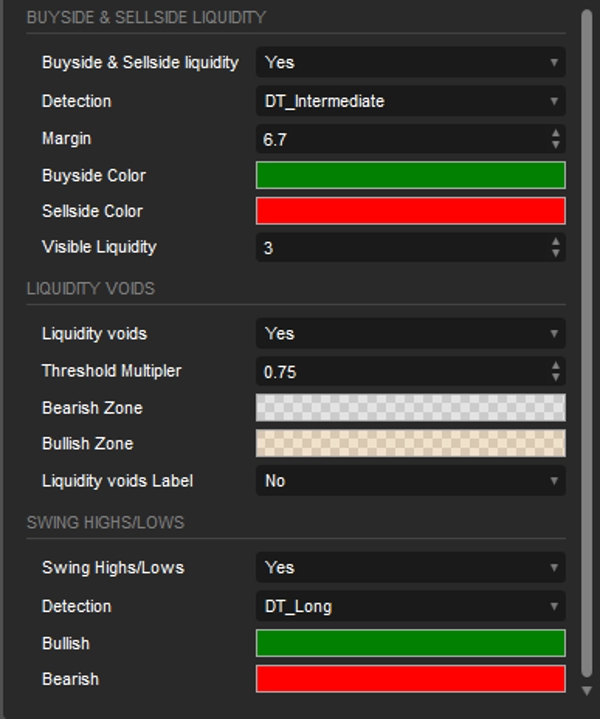
Kecairan Sisi Beli & Sisi Jual: Menghidupkan atau mematikan keterlihatan tahap kecairan sisi beli & sisi jual.
Pengesanan: Pilihan yang membolehkan pengguna mengesan kecairan sisi beli & sisi jual berdasarkan kepentingan tahap ayunan, termasuk jangka pendek, jangka sederhana, dan jangka panjang.
Margin: Menetapkan margin/sensitiviti untuk pengesanan tahap kecairan.
Kecairan Terlihat: Mengawal jumlah tahap/zona kecairan yang akan divisualisasikan.
- Kekosongan Kecairan
Kekosongan Kecairan: Menghidupkan paparan kekosongan kecairan bullish dan bearish.
Pendaraban Ambang: Menentukan pendaraban untuk ambang, yang dikodkan keras kepada julat ATR 200-periode.
Label: Menghidupkan paparan label yang menunjukkan kekosongan kecairan.
- Titik Ayunan
Ayunan Tinggi/Rendah: Menghidupkan atau mematikan keterlihatan tahap ayunan.
Pengesanan: Pilihan yang membolehkan pengguna mengesan tahap ayunan berdasarkan kepentingan tahap ayunan, termasuk jangka pendek, jangka sederhana, dan jangka panjang.
Ringkasan
Key functionalities include:
- Market Structures: Detects Market Structure Shifts (potential trend reversals) and Breaks of Structure (trend continuations) based on price patterns.
- Order & Breaker Blocks: Highlights significant price zones where institutional buying/selling or strong reversals occur.
- Buy-side & Sell-side Liquidity: Identifies zones of concentrated buying or selling interest that may influence price movements.
- Liquidity Voids: Marks price chart gaps with minimal trading activity, often leading to sharp price moves.
- Swing Points: Detects short-, intermediate-, and long-term reversal points to aid in trend analysis and trade decision-making.
The tool offers customizable settings to toggle visibility and detection sensitivity for each feature, including options to adjust detection based on swing level significance and display preferences. It supports analysis across various markets such as Forex, Crypto (e.g., BTCUSD), and indices (e.g., NAS100, XAUUSD). The indicator provides an objective framework for analyzing market dynamics based solely on price action patterns.
Ulasan pelanggan
5 | 67 % | |
4 | 0 % | |
3 | 33 % | |
2 | 0 % | |
1 | 0 % |


