
LT_Ind_SRZones
Indicador
3 compras
Versión 1.0, Oct 2025
Windows, Mac
4.6
Valoraciones: 3
Descripción
Nota: Probado solo en cTrader Windows.
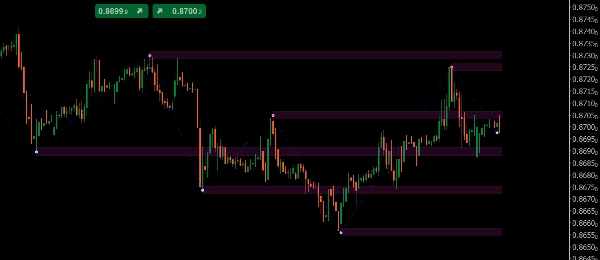
LT_Ind_SRZones detecta máximos/mínimos oscilantes, fusiona oscilaciones cercanas en zonas de Soporte/Resistencia, y mantiene tu gráfico enfocado en los niveles más relevantes alrededor del precio actual.
Lo que dibuja
- Zonas: bandas sombreadas construidas a partir de oscilaciones fusionadas
- Puntos de Máximo/Mínimo Oscilante
- ZigZag: camino para lectura rápida de la estructura
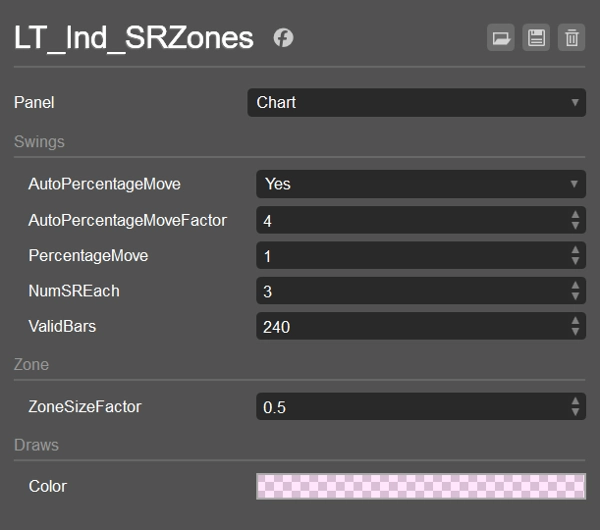
Controles clave
- AutoPercentageMove (bool) + AutoPercentageMoveFactor (double)
Ajusta automáticamente la sensibilidad del swing. Desactívalo para usar PercentageMove manualmente. - PercentageMove (double)
Movimiento mínimo (en %) para formar un swing cuando Auto está desactivado. - ZoneSizeFactor (double)
Altura de la zona =ZoneSizeFactor × ATR. - NumSREach (int)
Cuántas zonas superiores mantener por encima y por debajo del precio actual. - ValidBars (int)
Ignorar swings más antiguos que esta cantidad de barras. - Estilos de Color / Mostrar
Color de relleno de la zona (con alfa), estilos de Swing/ZZ.
Lógica de ordenación y filtro (cómo se eligen las zonas)
- Recolectar swings desde el más reciente hacia atrás, solo permanentes y no más antiguos que
ValidBars. - Contar swings por encima y por debajo del precio actual (incluyendo aquellos cuyo valor cae dentro de la mitad de una zona). Detener cuando ambos lados alcanzan
NumSREach. - Recurso: si un lado no tiene swing elegible, añadir un swing más antiguo para ese lado.
- Fusionar: para cada swing autorizado, o bien fusionar en una zona existente (
CanMerge) o crear una nueva zona. - Clasificar y seleccionar:
-
- Por encima del precio: ordenar zonas por (Alto − precio) ascendente, luego por MostRecentIndex descendente; tomar
NumSREach. - Por debajo del precio: ordenar por (precio − Bajo) ascendente, luego por MostRecentIndex descendente; tomar
NumSREach. - Unir las dos listas → zonas finales mostradas.
- Por encima del precio: ordenar zonas por (Alto − precio) ascendente, luego por MostRecentIndex descendente; tomar
Esto mantiene la visualización limpia, cercana y reciente, mientras maneja casos límite.
Valores predeterminados
- AutoPercentageMove = true, AutoPercentageMoveFactor = 4
- PercentageMove = 1.0 (usado cuando Auto = false)
- NumSREach = 1
- ValidBars = 240
- ZoneSizeFactor = 0.5 (altura de zona = 0.5 × ATR)
- Color de zona = #21FF33E0 (semi-transparente)
- Máximo Oscilante = #FFFF999A, Mínimo Oscilante = #FF99DFF9, ZigZag = Azul (Puntos)
Casos de uso
- Marcar zonas S/R cercanas para entradas, parciales o stops
- Observar cambios de zona (soporte → resistencia y viceversa)
- Combinar con VWAP/Pivotes para confluencia
Funciona en cualquier símbolo y marco temporal. Ligero y listo para trading en vivo o backtests.
Resumen
Resumen de IA
LT_Ind_SRZones is an indicator designed for cTrader Windows that automatically identifies and displays support and resistance zones derived from swing highs and lows. It detects swing points, merges nearby swings into shaded support/resistance zones, and highlights the most relevant levels around the current price to maintain a clear chart view. The indicator also plots swing high/low points and a ZigZag path for quick structural analysis.
Key adjustable parameters include automatic or manual swing sensitivity settings, zone size based on a factor of the Average True Range (ATR), the number of top zones to display above and below the current price, and the maximum age of swings considered. The indicator filters and ranks zones by proximity and recency, ensuring the display focuses on recent and nearby levels.
LT_Ind_SRZones works on any symbol and timeframe, supporting markets such as Forex, indices, commodities, cryptocurrencies, and stocks. It is suitable for live trading and backtesting. Typical use cases include marking nearby support/resistance zones for trade entries, stops, or partial exits, monitoring zone flips (support to resistance and vice versa), and combining with other indicators like VWAP or pivots for confluence.
Perfil del indicador
Valoraciones de clientes
4.6
Valoraciones: 3
5 | 67 % | |
4 | 33 % | |
3 | 0 % | |
2 | 0 % | |
1 | 0 % |
Valoraciones de clientes
October 22, 2025
October 15, 2025
the routine feels easier to keep, but the chart still needs a human read.
Conversación
Preguntas frecuentes
Prop
Forex
Indices
Commodities
Crypto
Stocks
Los productos disponibles a través de cTrader Store, incluidos bots, indicadores y plugins para operar, son proporcionados por desarrolladores de terceros y están disponibles únicamente con fines informativos y de acceso técnico. cTrader Store no es un bróker, por lo que no proporciona asesoramiento de inversión, recomendaciones personales ni ninguna garantía de rentabilidad futura.


![Logotipo de "[Hamster-Coder] Bollinger Bands"](https://cdn.ctrader.com/image/webp/21d8e5d6-fb11-4bac-b9ee-cd05c2b76804_30327)

Precio
Desde 25/09/2024
34
Ventas