
Beschreibung
Die ultimative Candlestick-Suite hilft Ihnen dabei, die meisten der heute existierenden Candlestick-Muster zu erkennen.
Candlestick-Muster, die technische Handelswerkzeuge sind, werden seit Jahrhunderten verwendet, um die Kursrichtung vorherzusagen. Es gibt verschiedene Candlestick-Muster, die verwendet werden, um Kursrichtung und Momentum zu bestimmen, darunter Three Line Strike, Two Red Gapping, Three Red Crows, Evening Star und Abandoned Baby.
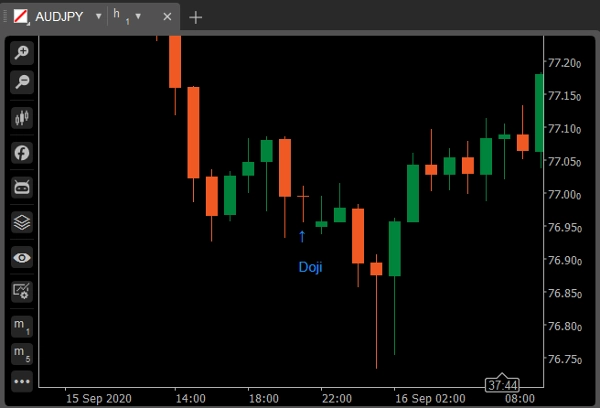
Doji
Ein Doji-Candlestick entsteht, wenn Eröffnung und Schluss eines Wertpapiers für den gegebenen Zeitraum praktisch gleich sind und signalisiert im Allgemeinen ein Umkehrmuster für technische Analysten. Die Körpergrenze liegt bei maximal 5 % der Gesamtlänge.
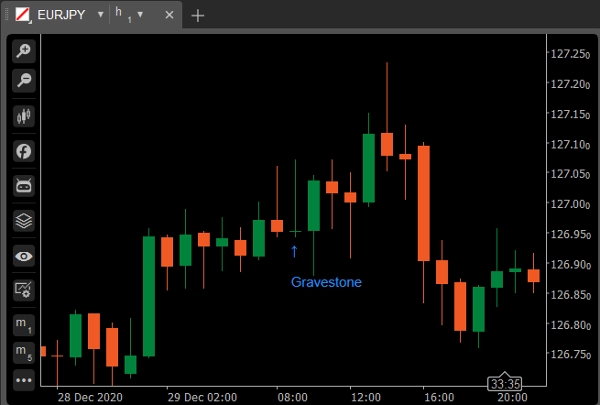
Variation: Gravestone Doji
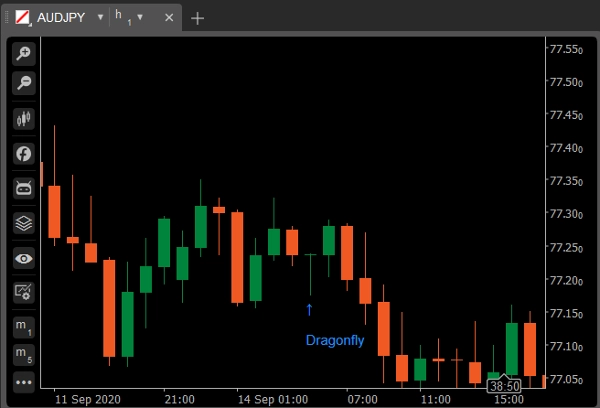
Er entsteht, wenn der Höchstkurs, die Eröffnung und der Schlusskurs des Vermögenswerts (fast) gleich sind. Der lange untere Schatten deutet darauf hin, dass während der Kerze aggressiv verkauft wurde, aber da der Kurs nahe der Eröffnung schloss, zeigt dies, dass Käufer den Verkauf absorbieren und den Kurs wieder nach oben treiben konnten.
Variation: Dragonfly Doji
Ein Gravestone Doji tritt auf, wenn Tief, Eröffnung und Schluss (fast) gleich sind und die Kerze einen langen oberen Schatten hat. Der Gravestone sieht aus wie ein umgedrehtes „T“. Die Bedeutung des Gravestone ist dieselbe wie die des Dragonfly. Beide deuten auf mögliche Trendwenden hin, müssen jedoch durch die folgende Kerze bestätigt werden.
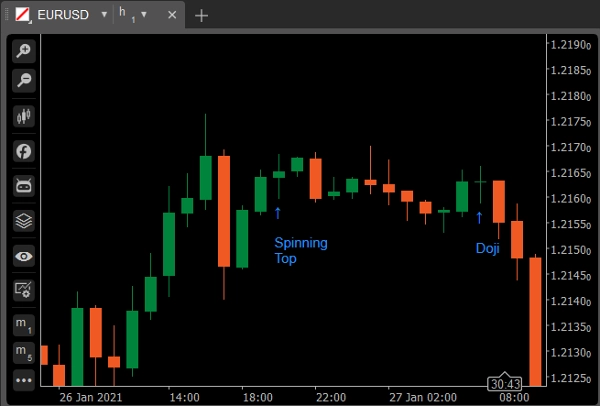
Spinning Top
Ein Spinning Top ist ein Candlestick-Muster mit einem kurzen echten Körper, der vertikal zwischen langen oberen und unteren Schatten zentriert ist. Das Muster steht für Unentschlossenheit bezüglich der zukünftigen Richtung des Vermögenswerts. Weder Käufer noch Verkäufer konnten die Oberhand gewinnen. Die Körpergrenze liegt bei maximal 20 % der Gesamtlänge.
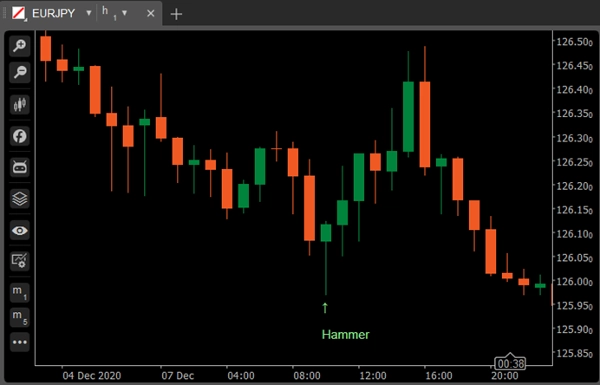
Hammer
Hammer Ein grüner oder roter Candlestick, der aus einem kleinen Körper nahe dem Hoch mit wenig oder keinem oberen Schatten und einem langen unteren Schwanz besteht. Wird während eines Abwärtstrends als bullishes Muster betrachtet.
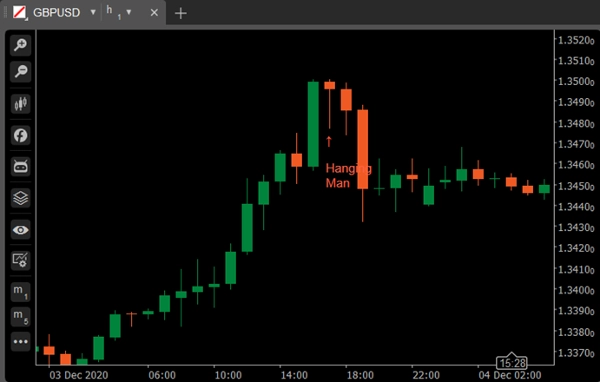
Variation: Hanging Man
Ein grüner oder roter Candlestick, der aus einem kleinen Körper nahe dem Hoch mit wenig oder keinem oberen Schatten und einem langen unteren Schwanz besteht. Wird während eines Aufwärtstrends als bearishes Muster betrachtet.
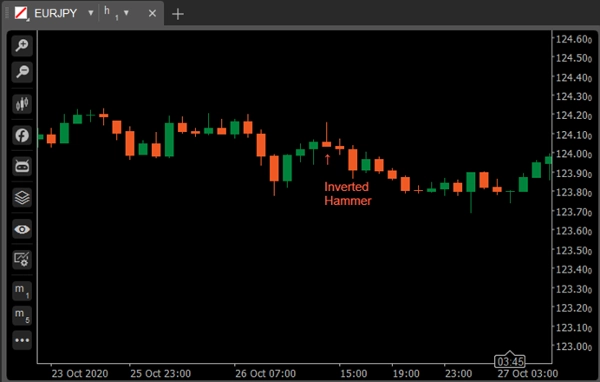
Inverted Hammer
Der Inverted Hammer ist eine Art Candlestick-Muster, das nach einem Abwärtstrend gefunden wird und normalerweise als Trendwende-Signal angesehen wird.
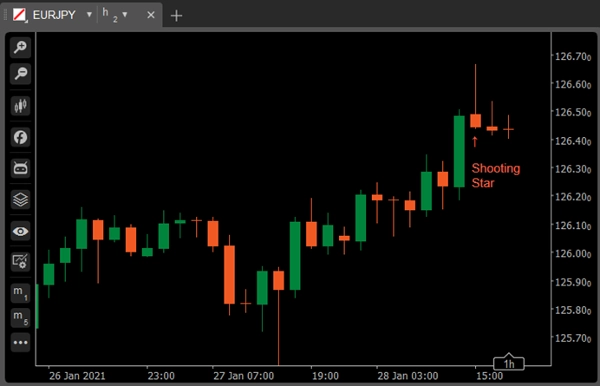
Variation: Shooting Star
Der Shooting Star sieht genau wie der Inverted Hammer aus, wird aber nicht in einem Abwärtstrend, sondern in einem Aufwärtstrend gefunden und hat daher eine andere Bedeutung.
Marubozu
Ein langer oder normaler Candlestick (rot oder grün) ohne Schatten oder Schwanz. Hoch und Tief repräsentieren die Eröffnungs- und Schlusskurse. Wird als Fortsetzungsmuster betrachtet.
Variation: Marubozu Open
Beim Marubozu Open sollte der Eröffnungskurs flach sein: d.h. die Kursbewegung sollte sich nur in eine Richtung bewegen, aber im Gegensatz zum vollständigen Marubozu-Kerzenkörper kann der Schlusskurs auf der anderen Seite leicht vom Hoch/Tief abweichen. Mit anderen Worten, die Eröffnung sollte flach sein, während auf der anderen Seite Platz für einen kurzen Docht ist.
Variation: Marubozu Close
Die Marubozu Close-Kerze ist das Gegenteil vom Marubozu Open: Der Schlusskurs sollte flach sein, während sich die Kursbewegung auf der anderen Seite leicht bewegen kann, bevor sie beginnt, aggressiv in eine Richtung zu handeln.
Bullish Engulfing
Besteht aus einem kleineren roten Körper, der im folgenden großen grünen Candlestick enthalten ist. Wenn es am Tief erscheint, wird es als wichtiges Umkehrsignal interpretiert.
Bearish Engulfing
Besteht aus einem kleineren grünen Körper, der im folgenden großen roten Candlestick enthalten ist. Wenn es am Hoch erscheint, gilt es als wichtiges Umkehrsignal.
Piercing Line
Piercing Line besteht aus einem roten Candlestick, gefolgt von einem grünen Candlestick, der niedriger als das Tief des vorherigen öffnet, aber mehr als zur Hälfte in den roten Körper schließt. Es wird als Umkehrsignal betrachtet, wenn es am Tief erscheint.
Dark Shadow Cover
Besteht aus einem langen grünen Candlestick, gefolgt von einem roten Candlestick, der über dem Hoch des grünen Candlesticks öffnet und weit in den Körper des grünen Candlesticks schließt. Es wird als bearishes Umkehrsignal während eines Aufwärtstrends betrachtet.
Bullish Harami
Besteht aus einem ungewöhnlich großen roten Körper, gefolgt von einem kleinen grünen Körper (innerhalb des großen roten Körpers). Es wird als bullishes Muster betrachtet, wenn es von einem Abwärtstrend vorausgegangen ist.
Variation: Bullish Harami Cross
Ein großer roter Körper, gefolgt von einem Doji. Es wird als Umkehrsignal betrachtet, wenn es am Tief erscheint.
Bearish Harami
Bearish Harami besteht aus einem ungewöhnlich großen grünen Körper, gefolgt von einem kleinen roten Körper (innerhalb des großen grünen Körpers). Es wird als bearishes Muster betrachtet, wenn es von einem Aufwärtstrend vorausgegangen ist.
Variation: Bearish Harami Cross
Ein großer grüner Körper, gefolgt von einem Doji. Wird als Umkehrsignal betrachtet, wenn es am Hoch erscheint.
Bullish/Bearish Kicker
Das Bullish Kicker-Signal tritt oft nach einer großen Überraschung in den Nachrichten auf, die vor oder nach den Marktzeiten bekannt gegeben wird. Etwas Drastisches ist passiert, was zu einer großen Verschiebung der Anlegerstimmung führt, und eine Umkehr wird unvermeidlich folgen. Je größer die Lücke zwischen den beiden Kerzen, desto bedeutender das Signal.
Morning/Evening Star
Besteht aus einem großen grünen Körper-Candlestick, gefolgt von einem kleinen Körper-Candlestick (rot oder grün), der über dem vorherigen eine Kurslücke aufweist. Der dritte ist ein roter Körper-Candlestick, der weit innerhalb des großen grünen Körpers schließt. Es wird als Umkehrsignal betrachtet, wenn es auf dem oberen Niveau erscheint.
Variation: Abandoned Baby
Three Green Soldiers/Three Red Crows
Besteht aus drei langen grünen Candlesticks mit aufeinanderfolgenden höheren Schlusskursen. Die Schlusskurse liegen nahe oder auf ihren Höchstständen. Wenn es am Tief erscheint, wird es als Signal für eine Bodenwende interpretiert.
Besteht aus drei langen roten Candlesticks mit aufeinanderfolgenden niedrigeren Schlusskursen. Die Schlusskurse liegen nahe oder auf ihren Tiefstständen. Wenn es am Hoch erscheint, gilt es als Signal für eine Top-Wende.
Three Line Strike
Ein Three Line Strike ist eine Fortsetzungsgruppe von Candlesticks, die drei in Richtung eines Trends hat, gefolgt von einer letzten Kerze, die zum Startpunkt zurückzieht. Händler nutzen den Three Line Strike als Gelegenheit, bei einem jüngsten Trendtief zu kaufen oder bei einem jüngsten Hoch zu verkaufen.
Two Red Gapping
Das bearishe Two Red Gapping-Fortsetzungsmuster erscheint nach einem bemerkenswerten Hoch in einem Aufwärtstrend, mit einer Kurslücke nach unten, die zwei rote Balken mit niedrigeren Tiefs erzeugt. Dieses Muster sagt voraus, dass der Rückgang bis zu noch niedrigeren Tiefs andauern wird.
Zusammenfassung
Kundenbewertungen
5 | 100 % | |
4 | 0 % | |
3 | 0 % | |
2 | 0 % | |
1 | 0 % |


