
Mô tả
Một trong những sai lầm lớn nhất mà các nhà giao dịch mới mắc phải là họ cố gắng tạo càng nhiều thông tin càng tốt lên biểu đồ bằng cách thêm quá nhiều chỉ báo và kết quả là một biểu đồ đầy nhiễu với các đường và dữ liệu tạo ra đủ loại thông tin vô nghĩa khiến nhà giao dịch nhận được một câu chuyện mâu thuẫn.
Ưu điểm:
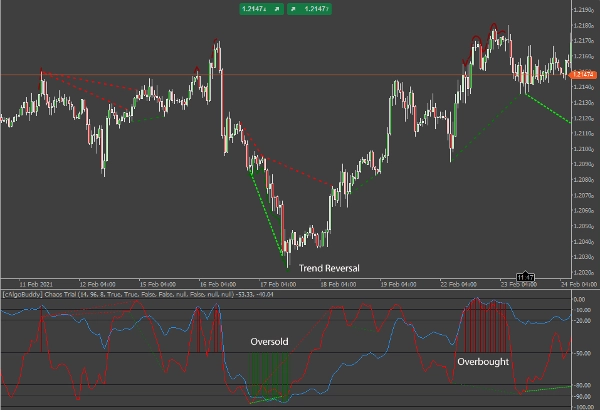
- Độ chính xác đáng kinh ngạc trong việc phát hiện các điểm đảo chiều.
- Dễ nhìn và dễ dàng nhận biết điều kiện thị trường.
- Có thể được sử dụng như một chỉ báo giao dịch theo xu hướng hoặc giao dịch ngược xu hướng.
- Kết quả kiểm tra lại mạnh mẽ (~95% chính xác trên các tín hiệu Cực đoan).
Nhược điểm:
- Ngay cả với điều kiện Quá mua "Cực đoan" và Quá bán "Cực đoan", chỉ báo đôi khi có thể khiến bạn giao dịch ngược chiều với một xu hướng rất mạnh gây ra các khoản lỗ lớn trước khi giá cuối cùng đảo chiều.
- Tín hiệu Quá mua "Cực đoan" và Quá bán "Cực đoan" có thể rất hiếm khi giao dịch trên khung thời gian 15 phút trở lên. Để khắc phục điều này, khuyến nghị giao dịch ít nhất 8 cặp chính để nhận được tín hiệu Cực đoan thường xuyên.
Cách sử dụng Chaos Reversals
Một hệ thống đơn giản và thành công sử dụng Chaos có thể được tạo ra bằng cách đánh dấu các đường Hỗ trợ và Kháng cự Tuần và Ngày và giao dịch ngược xu hướng các lần bật lại sắp tới từ các đường hỗ trợ và kháng cự đó bằng cách sử dụng các tín hiệu Quá mua Cực đoan và Quá bán Cực đoan của Chaos 15 phút.
Các tín hiệu được tạo ra như sau:
- W%R nhanh di chuyển trước, sau đó là W%R chậm.
- Khi W%R nhanh đơn lẻ bị Quá bán hoặc Quá mua, bạn có thể lướt sóng các điểm đảo chiều này.
- Khi cả W%R nhanh và chậm đều bị Quá bán hoặc Quá mua, điều này cho thấy thị trường sẽ đảo chiều một cách đáng kể.
Chỉ báo sẽ vẽ một đường màu đỏ hoặc xanh lá trên các đáy hoặc đỉnh trên biểu đồ giá, cũng như vẽ các đường màu đỏ hoặc xanh lá trong khu vực chỉ báo để đánh dấu các điều kiện quá bán hoặc quá mua cực đoan. Bạn có thể tắt tính năng này trong tùy chọn của chỉ báo.
Phát hiện Phân kỳ
Vì W%R là một bộ dao động, nó cho chúng ta cơ hội để phát hiện và giao dịch các phân kỳ. Có hai loại phân kỳ chính: Phân kỳ Thường và Phân kỳ Ẩn.
- Phân kỳ thường là dấu hiệu của sự đảo chiều trong hướng giá.
- Phân kỳ ẩn là dấu hiệu của sự tiếp diễn trong hướng giá.
Trong mỗi loại chính, có một phân loại phụ: Phân kỳ Bearish (Tiêu cực) và Phân kỳ Bullish (Tích cực).
- Phân kỳ bearish xảy ra khi chỉ báo di chuyển xuống trong khi giá tăng hoặc đi ngang.
- Phân kỳ bullish xảy ra khi chỉ báo di chuyển lên trong khi giá giảm hoặc đi ngang.
Phân kỳ Thường
Phân kỳ Thường đơn giản nhất là khi:
- Giá tạo đỉnh cao hơn trong khi đường W%R nhanh tạo đỉnh thấp hơn: Có khả năng bán khống.
- Giá tạo đáy thấp hơn trong khi đường W%R nhanh tạo đáy cao hơn: Có khả năng mua vào.
Trong cả hai trường hợp, nhà giao dịch tìm kiếm khả năng đảo chiều trong hành động giá.
Phân kỳ thường được sử dụng tốt nhất như một sự so sánh giữa Đỉnh Swing hoặc Đáy Swing hiện tại với Đỉnh Swing hoặc Đáy Swing trước đó. Với phân kỳ thường, xu hướng đang yếu đi và tâm lý thị trường đã chuyển sang hướng ngược lại. Các nhà giao dịch có thể chuẩn bị giao dịch một sự đảo chiều hoặc điều chỉnh thuận lợi.
Trong Chaos Reversals, phân kỳ thường được hiển thị như sau:
- Phân kỳ Thường Bullish – Đường nét đứt màu xanh lá sáng.
- Phân kỳ Thường Bearish – Đường nét đứt màu đỏ
LƯU Ý: Các đường phân kỳ xuất hiện tại điểm mở cửa của thanh sau khi phân kỳ được xác nhận.
Phân kỳ Ẩn
Phân kỳ Ẩn đơn giản nhất là khi:
- Đường W%R nhanh tạo đáy thấp hơn trong khi giá tạo đáy cao hơn: có khả năng mua vào.
- Đường W%R nhanh tạo đỉnh cao hơn trong khi giá tạo đỉnh thấp hơn: có khả năng bán khống.
Trong cả hai trường hợp, nhà giao dịch tìm kiếm khả năng tiếp diễn trong hành động giá.
Phân kỳ ẩn được sử dụng tốt nhất để đánh giá giá liên quan đến xu hướng hiện tại. Sau một đợt điều chỉnh, giá thường tiếp tục theo hướng xu hướng về mức Đỉnh Swing hoặc Đáy Swing cuối cùng. Với phân kỳ ẩn, xu hướng có thể đang yếu đi nhưng chưa kết thúc. Như minh họa dưới đây, thị trường đã điều chỉnh có thể do chốt lời và có xu hướng tiếp tục xu hướng giảm.
Trong Chaos Reversals, phân kỳ ẩn được hiển thị như sau:
- Phân kỳ Ẩn Bearish – Đường nét đứt rộng màu xanh lá
- Phân kỳ Ẩn Bullish – Đường nét đứt rộng màu đỏ đậm
Giao dịch với Phân kỳ
Đây là một lưu ý nhanh về sự thận trọng khi giao dịch với Phân kỳ. Hãy nhận thức rằng thị trường có thể không di chuyển theo hướng của tín hiệu Phân kỳ. Điều quan trọng là hiểu rằng Phân kỳ là dấu hiệu của một khả năng thay đổi hoặc tiếp diễn trong hướng thị trường. Việc theo dõi chuyển động giá để xác nhận hướng thị trường là rất quan trọng. Ngoài ra, hãy chú ý đến hướng tổng thể của Chỉ báo Chaos, bằng cách so sánh các đường chỉ báo với các mức (0 cho quá mua cực đoan, -100 cho quá bán cực đoan)
Cảnh báo & Thông báo
Các tín hiệu sẽ được gửi là bắt đầu và kết thúc Quá mua/Quá bán Cực đoan, đỉnh W%R chậm ở các vị trí cực đoan cũng như tất cả các phân kỳ.
Cảnh báo Telegram
Giả sử bạn đã có bot và kênh được thiết lập trên Telegram, chỉ báo Chaos Reversals sẽ gửi cho bạn các tin nhắn về các tín hiệu đã được xác nhận trên cặp tiền tệ.
QUAN TRỌNG:
Vui lòng đảm bảo rằng Múi giờ của bạn được điều chỉnh chính xác theo giờ địa phương (góc dưới bên phải của ứng dụng).
Cảnh báo trên máy tính để bàn
Nếu bạn chọn Có, chỉ báo Chaos Reversals sẽ đẩy thông báo hộp tin nhắn trên máy tính cá nhân của bạn khi có tín hiệu được xác nhận.
Cảnh báo Email
Để chức năng này hoạt động, bạn phải cấu hình cTrader của mình để có thể gửi email (Cài đặt-> Email).
Tóm tắt
Đánh giá của khách hàng
5 | 100 % | |
4 | 0 % | |
3 | 0 % | |
2 | 0 % | |
1 | 0 % |


