
Descripción
Indicadores de Pinescriptlabs Store: 🤖Pinescriptlabs Store cBots : (cBot)
PRICE ACTION (Nuevo)
Gold & BTC BreakoutSession Pivots(nuevo)
Trailing Smart Algorithm(Nuevo)
SmartTrend Support &
Resistance
Lines
Dynamic
Market Structure
Analysis
of
Turning Points
Fibonacci
Linear
Regression
Multi-timeframe
Multi-Level
Candle Bias
Tracker
Auto
Support and
Resistance
Trend
Lines
All
Support and
Resistance
Levels
Zig Zag Support & Resistance with Swings
1. ¿Qué hace este indicador? ❓
🔍 Detecta oscilaciones de precio (máximos y mínimos)
- Escanea barras recientes ("Profundidad de análisis") para encontrar el precio más alto/bajo en ese rango.
- Valida oscilaciones con un umbral % (p.ej., cambio de 1%+ vs. la última oscilación) → Marca nuevos ✅ máximos/mínimos de oscilación.
- Reduce el ruido ⚡: Solo confirma oscilaciones si la mitad del período de análisis transcurre sin un máximo más alto/mínimo más bajo.
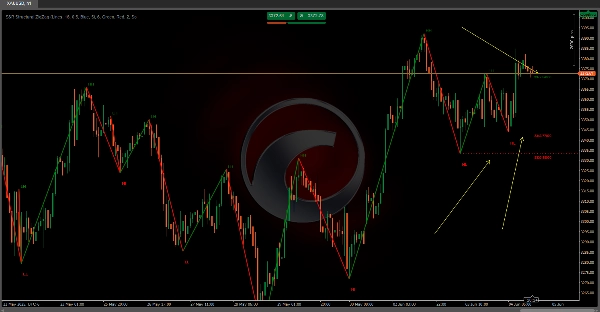
📉 Dibuja líneas de tendencia Zigzag
- Conecta oscilaciones con líneas dinámicas:
-
- 🟢 Verde = Tendencia alcista (nueva oscilación > anterior).
- 🔴 Rojo = Tendencia bajista (nueva oscilación < anterior).
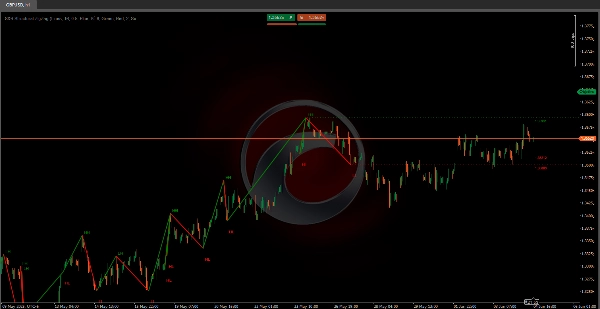
⏹️ Resalta niveles clave
- Líneas de soporte/resistencia: Dibujadas en el precio exacto de cada oscilación, extendidas hacia la derecha
- Las etiquetas muestran valores de precio 📌 (p.ej., "1.1050") para análisis instantáneo.
🚦 Revela la estructura del mercado
- Identifica tendencias de un vistazo:
-
- Alcista = Máximos más altos (HH) + Mínimos más altos (HL).
- Bajista = Máximos más bajos (LH) + Mínimos más bajos (LL).
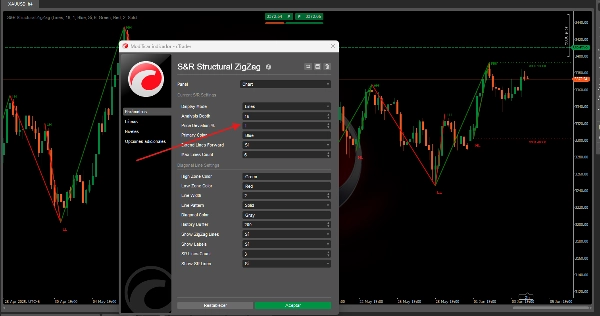
2. Cómo usarlo (Guía de configuración) ⚙️
Instalar en cTrader: ¡Arrastra y suelta en tu gráfico!
Configuraciones clave:
- Profundidad de análisis 🔎:
10(por defecto) → Valores más altos filtran el ruido; valores más bajos capturan más oscilaciones. - Desviación de precio % 📏:
1.0%(ajustable) → Cambio mínimo de precio para validar oscilaciones. - Etiquetas de oscilación 🏷️ (HH/HL/LH/LL): Activar/Desactivar.
- Extender líneas ➡️: Proyectar niveles S/R infinitamente o limitar a las barras actuales.
Resumen
Valoraciones de clientes
5 | 100 % | |
4 | 0 % | |
3 | 0 % | |
2 | 0 % | |
1 | 0 % |


