
Revoluciona tu análisis de gráficos
Adéntrate en el futuro del análisis técnico con Delta-RSI Candle Pro – el indicador innovador que transforma las velas ordinarias en potentes visualizadores de momentum. ¿Por qué saturar tu pantalla con múltiples indicadores cuando puedes tener todo lo que necesitas directamente en las velas?
La solución visual todo en uno para el trading
-
- Reconocimiento inmediato de señales: Fuerza y dirección del momentum mostradas intuitivamente mediante colores
- Maximiza el espacio en pantalla: Elimina para siempre los paneles separados de osciladores
- Precisión matemática: Regresión polinómica avanzada que calcula el verdadero momentum del RSI
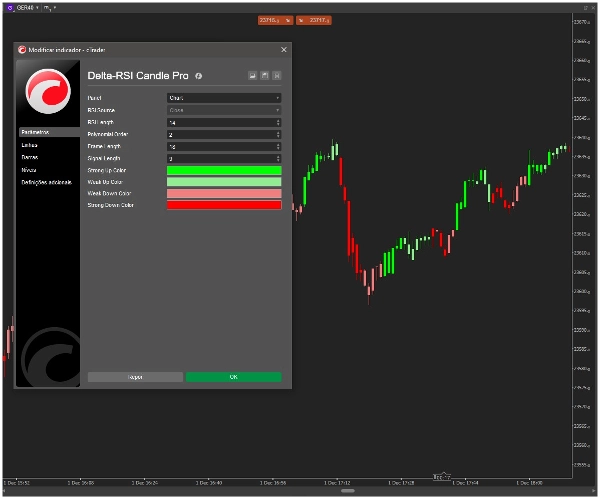
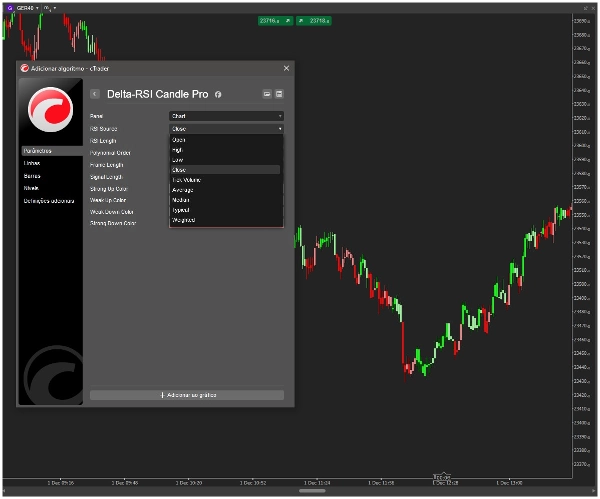
- Personalización completa: Usa los selectores de color nativos de cTrader para adaptar tu estilo de trading
- Confiable y preciso: Cálculos sin repintado basados en datos de precio confirmados
Cómo funciona Delta-RSI Candle Pro
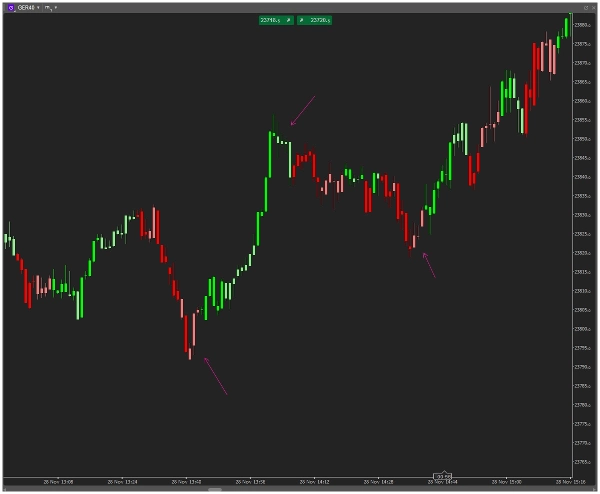
Nuestro algoritmo propietario calcula la derivada instantánea del RSI usando ajuste de curva polinómica, luego asigna colores inteligentes a cada vela:
-
- Fuerte alcista: Verde intenso – Momentum positivo acelerándose
- Alcista leve: Verde claro – Momentum positivo pero con precaución
- Bajista leve: Rojo claro – Momentum negativo pero con posible reversión
- Fuerte bajista: Rojo intenso – Momentum negativo acelerándose
Características clave que nos distinguen
-
- 🎯 Integración directa en las velas: Los colores aparecen directamente en tus velas de trading
- 🎨 Selección visual de colores: Selectores de color intuitivos de cTrader – sin necesidad de nombres de código
- ⚙️ Totalmente ajustable: Ajusta la longitud del RSI, el orden polinómico y el período de retroceso
- 🚀 Rendimiento optimizado: Motor de cálculo ligero para una operación fluida
- 📊 Algoritmo de grado profesional: Análisis matemático de derivadas para señales superiores
¿Quién se beneficia más?
-
- Traders diarios que necesitan señales visuales instantáneas de momentum
- Traders swing que identifican cambios de tendencia temprano
- Traders minimalistas a quienes les disgusta el desorden en el gráfico
- Traders algorítmicos que buscan confirmación visual
- Todos los traders serios que desean una ventaja en el análisis de mercado
Comienza en segundos
-
- Agrega Delta-RSI Candle Pro a tu gráfico
- Selecciona tus colores preferidos usando los selectores visuales
- Ajusta los parámetros para que coincidan con tu marco temporal de trading
- Observa inmediatamente cómo emergen patrones de momentum en tus velas
Excelencia técnica
-
- Tipo de indicador superpuesto (sin panel separado)
- Algoritmo sin repintado
- Cálculo polinómico derivado del RSI
- Compatible con todos los símbolos y marcos temporales
- Actualizaciones y mejoras regulares
Mientras que otros indicadores añaden complejidad, Delta-RSI Candle Pro simplifica y mejora. Hemos tomado un análisis matemático avanzado del momentum y lo hemos hecho visualmente intuitivo. Ya no tendrás que dividir tu atención entre el precio y los indicadores – ahora trabajan juntos como un sistema cohesivo.
¿Listo para ver tus gráficos de una manera revolucionaria?...
5 | 100 % | |
4 | 0 % | |
3 | 0 % | |
2 | 0 % | |
1 | 0 % |


![Logotipo de "[Hamster-Coder] Bollinger Bands"](https://cdn.ctrader.com/image/webp/21d8e5d6-fb11-4bac-b9ee-cd05c2b76804_30327)


