
Deskripsi
Kuasi Volatilitas Pasar Tanpa Kekacauan Grafik
The Squeeze Momentum Candle Painter adalah indikator volatilitas dan momentum canggih yang didasarkan pada logika klasik TTM Squeeze. Alih-alih memenuhi layar Anda dengan osilator, alat ini secara cerdas mewarnai batang harga Anda, memungkinkan Anda mengidentifikasi pergerakan eksplosif dengan probabilitas tinggi dan pergeseran tren sambil menjaga grafik utama Anda tetap bersih dan profesional.
Ikhtisar
Pasar bertransisi antara dua keadaan: Kompresi (Squeeze) dan Ekspansi (Volatilitas). Indikator ini menggunakan hubungan antara Bollinger Bands dan Keltner Channels untuk mengidentifikasi fase-fase ini, dikombinasikan dengan algoritma momentum Regresi Linear untuk menentukan arah dan kekuatan tren.
Fitur Utama
-
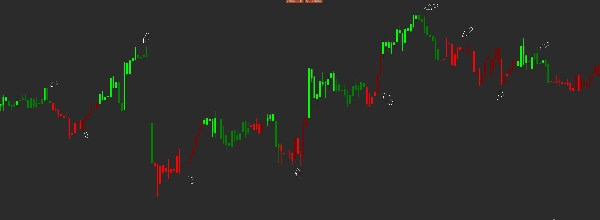
- Kode Warna Intuitif: Mengenali momentum tren secara instan melalui 4 warna lilin yang berbeda.
- Algoritma TTM Squeeze: Perhitungan bawaan dari kompresi harga dan kemiringan momentum.
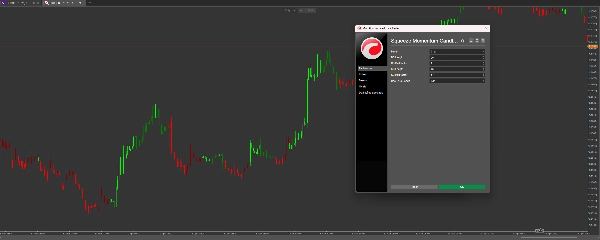
- Desain UI Bersih: Menghilangkan kebutuhan jendela histogram terpisah, memberi Anda lebih banyak ruang untuk analisis aksi harga.
- Sepenuhnya Dapat Disesuaikan: Sesuaikan parameter Bollinger Band dan Keltner Channel untuk cocok dengan kerangka waktu atau kelas aset apa pun (Forex, Indeks, atau Kripto).
- Logika Tanpa Lag: Menggunakan regresi linear untuk mendeteksi pergeseran momentum lebih cepat daripada rata-rata bergerak tradisional.
Cara Membaca Warna :
-
- Lime » Momentum naik yang kuat (Meningkat)
- Hijau » Momentum naik melemah (Melambat)
- Merah » Momentum turun yang kuat (Meningkat)
- Marun » Momentum turun melemah (Melambat)
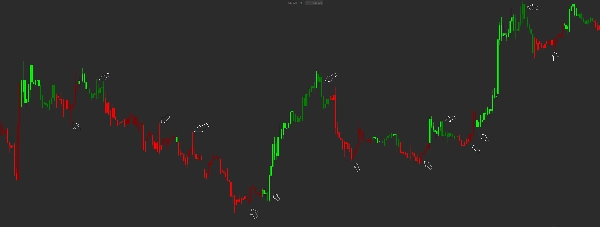
Strategi Perdagangan
Persiapan: Ketika momentum rendah (Marun atau Hijau), pasar sering "menyempit" atau berkonsolidasi.
Breakout: Cari transisi dari Hijau ke Lime (Bullish) atau Marun ke Merah (Bearish). Ini menunjukkan momentum sedang mempercepat.
Keluar: Ketika lilin Lime berubah menjadi Hijau, atau lilin Merah berubah menjadi Marun, itu menandakan bahwa pergerakan saat ini kehilangan tenaga—waktu yang tepat untuk mengambil keuntungan atau memperketat Stop Loss.
Mengapa Memilih Indikator Ini?
Kebanyakan trader gagal karena mereka bereaksi terlambat. The Squeeze Momentum Candle Painter memvisualisasikan "energi internal" pasar. Dengan mengamati perubahan warna lilin, Anda mendapatkan keunggulan psikologis, bertahan lebih lama dalam perdagangan yang menang dan keluar sebelum pembalikan terjadi.
Ringkasan
Ulasan pelanggan
5 | 100 % | |
4 | 0 % | |
3 | 0 % | |
2 | 0 % | |
1 | 0 % |


