Descripción
Impulse Matrix Pro 🚀
¿Qué es?
https://chartshots.spotware.com/c/69d5282dc32e0
Impulse Matrix Pro es un indicador superpuesto que genera señales de compra y venta 📈📉 solo cuando tres motores independientes coinciden simultáneamente. Combina detección de tendencia, rupturas de impulso y filtros inteligentes en un solo sistema confluyente con niveles integrados de gestión de riesgos 🛡️.
https://chartshots.spotware.com/c/69d5293d873fa
Los Tres Motores ⚙️
https://chartshots.spotware.com/c/69d5288a347ea
Motor 1 — Tendencia (SMEMA) 🌊
Un promedio móvil doblemente suavizado (exponencial → luego simple) crea la Línea Nexus.
- Si está subiendo → la tendencia es alcista 🟢.
- Si está bajando → bajista 🔴.
Alrededor de ella, 3 bandas de sobreenvoltura se dibujan arriba y abajo, espaciadas por el rango suavizado de la vela promedio. La posición del precio respecto a estas bandas determina la fuerza (0–3):
Fuerza
Significado
1/3
Precio más allá de la Banda 1
2/3
Precio más allá de la Banda 2
3/3
Precio más allá de la Banda 3 ⚡
Mayor fuerza mínima = menos pero señales de mayor calidad
Motor 2 — Impulso (BOSWaves)
Detecta eventos de ruptura de estructura usando bandas dinámicas construidas a partir de:
- Una línea base EMA
- Desviación Absoluta Media (MAD) como unidad de volatilidad
Comportamiento clave: Las bandas se contraen después de movimientos fuertes (más fácil de activar) y se expanden durante la consolidación (más difícil de activar). Esto está controlado por un puntaje de frescura del impulso que decae con el tiempo ⏳.
- Ruptura alcista: Cierre previo ≤ banda superior, cierre actual la cruza hacia arriba 🚀.
- Ruptura bajista: Cierre previo ≥ banda inferior, cierre actual la cruza hacia abajo 📉.
Motor 3 — Filtros Inteligentes 🛡️
Tres filtros que cada señal debe pasar:
- Volatilidad ATR: El mercado tiene suficiente movimiento para operar 🌊
- Momentum: El precio se está moviendo realmente en la dirección de la señal durante N barras 🏃♂️
- Frescura: El impulso no ha decaído — el movimiento aún está "vivo" 🔥
Condiciones de la Señal 🚦
COMPRAR — Las 7 deben ser verdaderas: ✅
- Línea Nexus en ascenso
- Fuerza alcista ≥ umbral mínimo
- Ruptura alcista de impulso detectada
- Dirección cambiada de bajista a alcista
- Filtro ATR aprobado
- Momentum confirma movimiento ascendente
- Frescura del impulso sobre el umbral
VENDER — Las 7 deben ser verdaderas: ✅
- Línea Nexus en descenso
- Fuerza bajista ≥ umbral mínimo
- Ruptura bajista de impulso detectada
- Dirección cambiada de alcista a bajista
- Filtro ATR aprobado
- Momentum confirma movimiento descendente
- Frescura del impulso sobre el umbral
Nota: Si alguna condición falla → no hay señal ❌.
Lógica de Stop Loss y Take Profit 📏
Todos los niveles son basados en ATR y totalmente adaptativos a la volatilidad actual 🔄.
- Distancia de Stop Loss = ATR × Multiplicador SL (por defecto 1.5)
Nivel
Cálculo
R:R por defecto
SL
Entrada ∓ (ATR × 1.5)
— 🛑
TP1
Entrada ± (distancia SL × 1.0)
1:1 🎯
TP2
Entrada ± (distancia SL × 2.0)
1:2 🎯🎯
TP3
Entrada ± (distancia SL × 3.0)
1:3 💰
Mercados volátiles → stops y objetivos más amplios. Mercados tranquilos → niveles más ajustados. Todo se escala automáticamente ⚖️.
Elementos Visuales 🎨
- Línea Nexus: Dirección central de la tendencia 🧵
- Bandas de Sobreenvoltura: Zonas de medición de fuerza con relleno degradado 📊
- Bandas de Impulso (punteadas): Umbrales dinámicos de ruptura 🏁
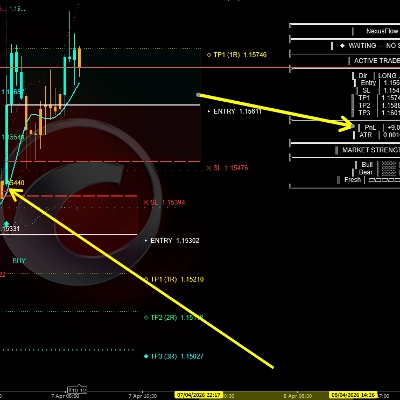
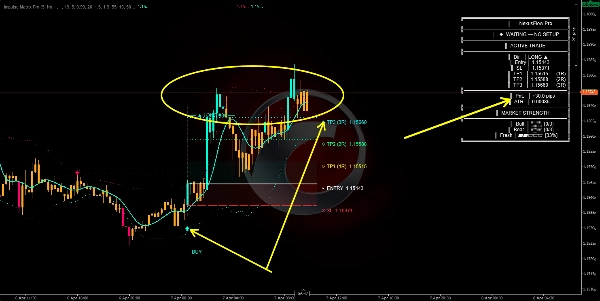
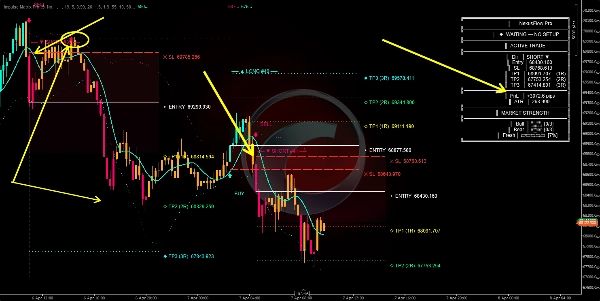
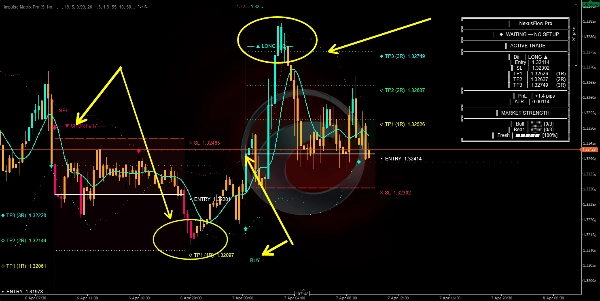
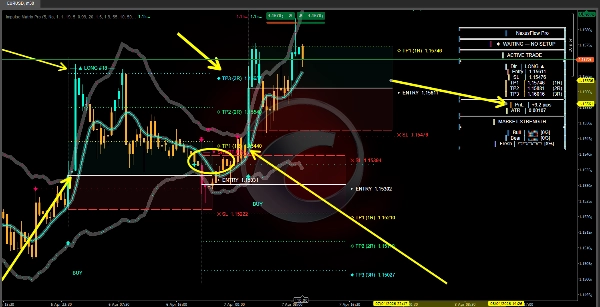
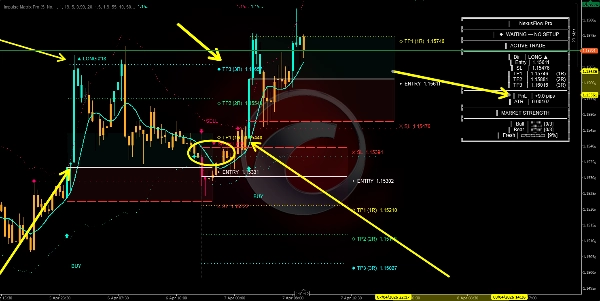
- Flechas COMPRAR / VENDER: Señales confirmadas de entrada 🏹
- Diamantes Blancos: Puntos de cambio de tendencia en la Línea Nexus 💎
- Líneas de Entrada / SL / TP: Niveles proyectados de operación 📐
- Zona Roja: Área de riesgo (Entrada a SL) ⚠️
- Zona Verde/Cian: Área de recompensa (Entrada a TP1) 🏆
- Estrellas + Líneas Horizontales: Señales de retesteo — el precio revisita la banda de impulso sin romperla ⭐
- Nube de Tendencia: Sutil sombreado de fondo que muestra la dirección dominante ☁️
- Colores de las Barras: Cian = alcista · Rosa = bajista · Naranja = sin configuración 🎨
- Panel de Información (arriba a la derecha): Datos en vivo de la operación, PnL, medidores de fuerza, indicador de frescura 🖥️
Cómo Usar 📖
- Espera una flecha COMPRAR/VENDER 🏹 — barras naranjas significan sin configuración, mantente fuera 🛑.
- Revisa el panel 🖥️ — mayor fuerza y frescura = mayor convicción.
- Opera los niveles proyectados 📏 — SL donde está marcado, toma parciales en TP1/TP2, deja correr el resto hasta TP3.
- Retestea las estrellas ⭐ pueden usarse como oportunidades adicionales para una posición existente.
- Señal opuesta 🔄 = la operación previa queda conceptualmente invalidada.
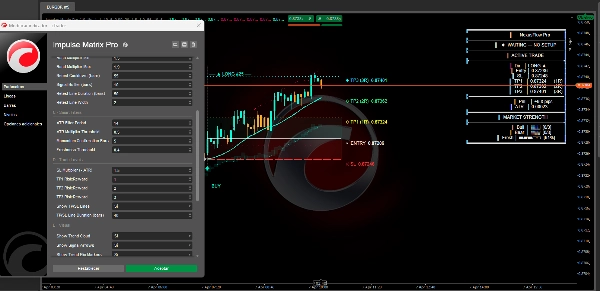
Parámetros Clave ⚙️
Parámetro
Valor Más Alto
Valor Más Bajo
Periodo del Ciclo
Tendencia más suave, señales más lentas
Más rápido, más reactivo ⚡
Fuerza Mínima
Menos señales, filtro más estricto
Más señales, menos filtrado 🔍
Longitud EMA de Tendencia
Línea base de impulso más suave
Rupturas más reactivas 🌊
Multiplicadores de Banda
Bandas de impulso más anchas, menos rupturas
Bandas más estrechas, más rupturas 📏
Umbral ATR
Requiere mayor volatilidad 🌪️
Permite señales de baja volatilidad
Umbral de Frescura
Solo impulsos frescos califican 🔥
Permite impulsos decaídos
Multiplicador SL
Stop loss más amplio 🛡️
Stop loss más ajustado 🎯
Ratios TP
Objetivos más ambiciosos 💰
Objetivos más conservadores
Descargo de responsabilidad ⚠️
Este indicador no ejecuta operaciones. Es una herramienta analítica 🧠. Los niveles TP/SL son sugerencias basadas en la volatilidad, no garantías de precio. Funciona mejor en condiciones de tendencia 📈. Combínalo con análisis de estructura de mercado y gestión adecuada de riesgos.
Resumen
Valoraciones de clientes
5 | 100 % | |
4 | 0 % | |
3 | 0 % | |
2 | 0 % | |
1 | 0 % |