
Daily SD Levels - Indicator
Indicador
4 compras
Versión 1.0, Aug 2025
Windows, Mac
5.0
Valoraciones: 1
Descripción
Niveles SD Diarios – Bandas Dinámicas de Desviación Estándar Basadas en VWAP
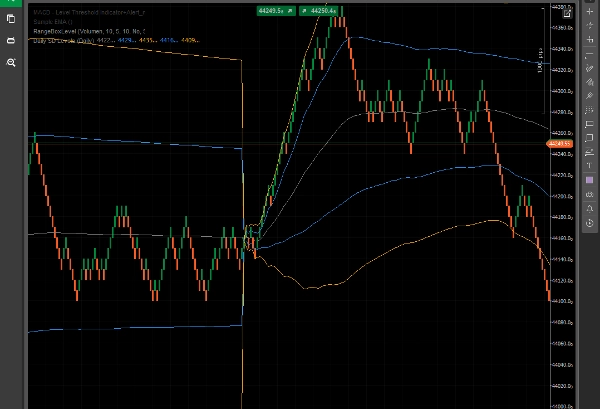
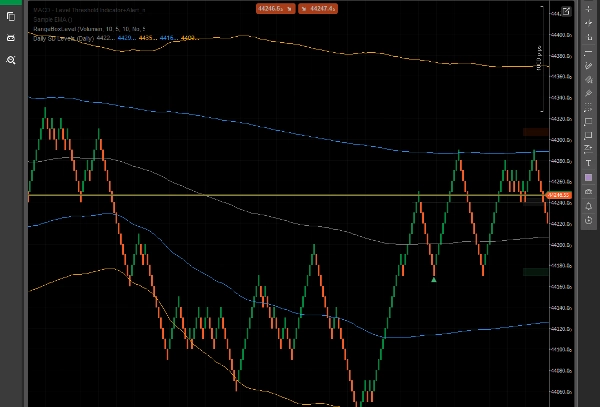
El indicador Niveles SD Diarios traza dinámicamente VWAP (Precio Promedio Ponderado por Volumen) y Bandas de Desviación Estándar (+1/+2 y -1/-2) calculadas durante el día de trading actual.
Esta herramienta ayuda a los traders a evaluar visualmente la volatilidad intradía, posibles zonas de soporte/resistencia y extremos de precio, todo basado en el volumen real del mercado y la acción del precio – no niveles fijos o arbitrarios.
Características Clave:
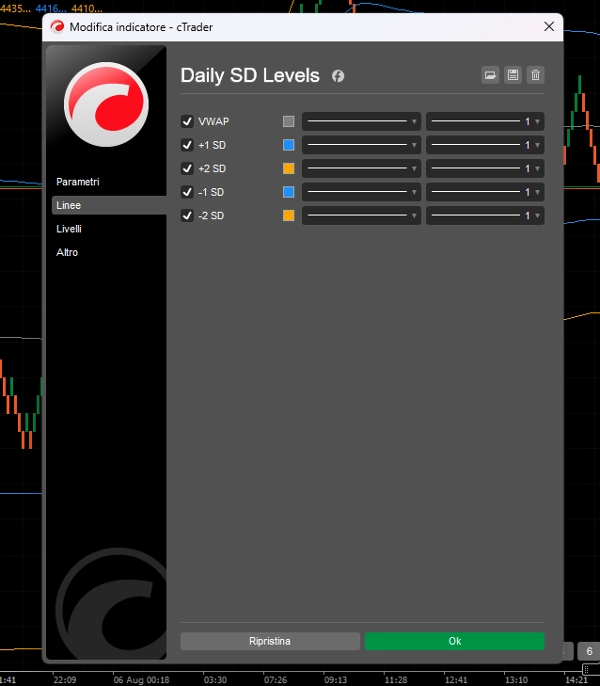
- Línea VWAP para el seguimiento del valor justo intradía.
- Bandas SD +1/+2 y -1/-2 para identificar zonas de sobrecompra/sobreventa.
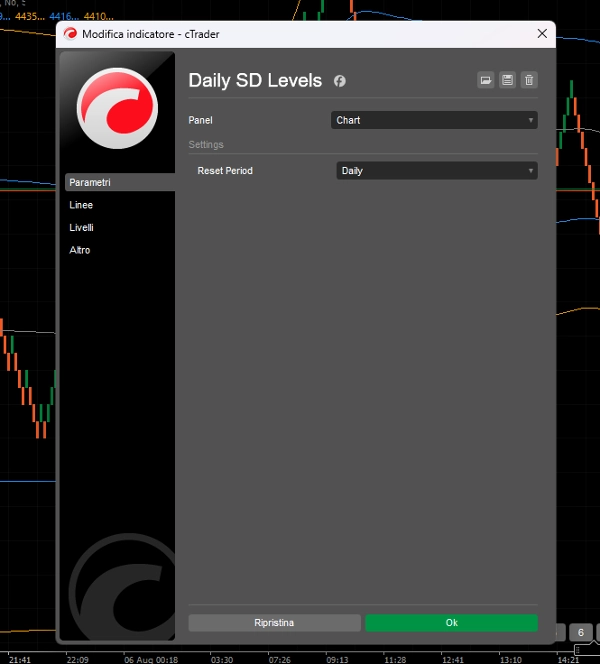
- Los niveles se reinician diariamente, adaptándose a la dinámica de precio y volumen de cada sesión.
- Optimizado para Renko, Range Bar y Trading Intradía.
- Diseñado para traders que necesitan claridad y zonas de precio dinámicas.
Este indicador es perfecto para:
- Configuraciones de reversión a la media.
- Identificar movimientos extendidos para posibles reversiones.
- Confirmación visual de rupturas más allá de los límites estadísticos.
Sin desorden. Solo niveles limpios y responsivos que se mueven con el mercado.
Resumen
Perfil del indicador
Valoraciones de clientes
5.0
Valoraciones: 1
5 | 100 % | |
4 | 0 % | |
3 | 0 % | |
2 | 0 % | |
1 | 0 % |
Valoraciones de clientes
August 8, 2025
it gives context without making the decision, but the chart still needs a human read.
Conversación
Preguntas frecuentes
Los productos disponibles a través de cTrader Store, incluidos bots, indicadores y plugins para operar, son proporcionados por desarrolladores de terceros y están disponibles únicamente con fines informativos y de acceso técnico. cTrader Store no es un bróker, por lo que no proporciona asesoramiento de inversión, recomendaciones personales ni ninguna garantía de rentabilidad futura.


![Logotipo de "Gaussian Channel [Iridio Capital]"](https://cdn.ctrader.com/image/webp/7c039209-5573-4a54-a072-f9528b503103_41960)

Precio
Desde 16/07/2025
5
Ventas