
CCI - With Arrows and 40 80 EMA Logic_noSourceCode
Indikator
2 käufe
Version 1.0, Feb 2025
Windows, Mac
5.0
Bewertungen: 1
Beschreibung
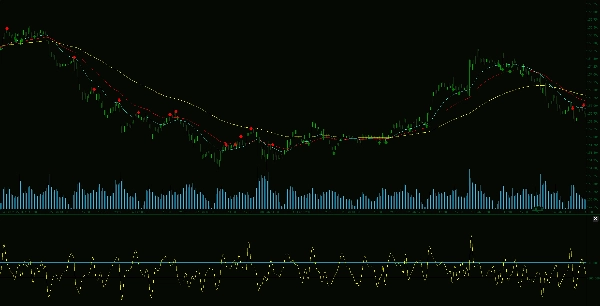
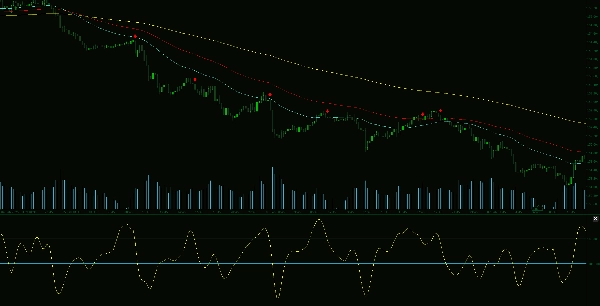
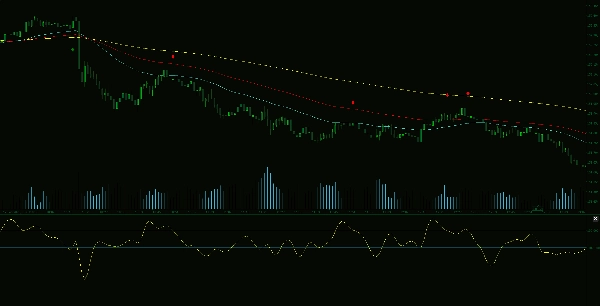
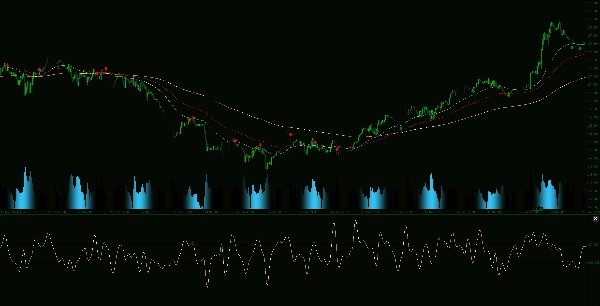
Der Advanced CCI & EMA Indikator ist ein leistungsstarkes Handelstool, das die Trendanalyse verbessert, indem es den Commodity Channel Index (CCI) mit der 40- und 80-EMA-Logik kombiniert. Dieser ausgeklügelte Ansatz erzeugt Pfeile, die potenzielle Kursbewegungen anzeigen und Händlern helfen, Handelsmöglichkeiten mit hoher Wahrscheinlichkeit zu identifizieren.
Hauptmerkmale:
Zusammenfassung
KI-Zusammenfassung
The Advanced CCI & EMA Indicator integrates the Commodity Channel Index (CCI) with 40 and 80-period Exponential Moving Averages (EMAs) to enhance trend analysis and momentum detection. It generates clear buy and sell arrows on the chart, signaling potential price movements based on combined momentum and trend confirmation. Key features include CCI-based identification of overbought and oversold conditions, EMA logic to confirm trend direction and filter weak signals, and customizable settings to adapt to various trading strategies and timeframes. This indicator supports traders in aligning with prevailing market trends and improving timing by reducing false reversal signals. It is suitable for use on indices and commodities markets.
Indikatorprofil
Kundenbewertungen
5.0
Bewertungen: 1
5 | 100 % | |
4 | 0 % | |
3 | 0 % | |
2 | 0 % | |
1 | 0 % |
Kundenbewertungen
February 25, 2025
half size is enough at the start. Low quality setups lose some appeal.
Diskussion
Häufig gestellte Fragen (FAQ)
Indices
Commodities
Über den cTrader Store verfügbare Produkte, einschließlich Handelsbots, Indikatoren und Plugins, werden von externen Entwicklern bereitgestellt und nur zu Informations- und technischen Zugriffszwecken verfügbar gemacht. cTrader Store ist kein Broker und erbringt keine Anlageberatung, persönlichen Empfehlungen oder eine Garantie für zukünftige Performance.


![„[Stellar Strategies] MARSI Signal Plotter“-Logo](https://cdn.ctrader.com/image/webp/7b2b8da6-8f8e-4646-8d4a-4710c516c01e_25567)


Preis
Seit 14/01/2025
55
Verkäufe
11.44K
Kostenlose Installationen