
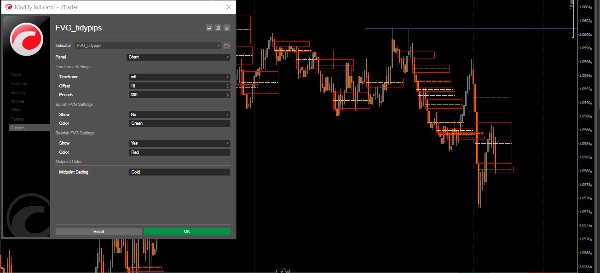
FVG_tidypips
Indicador
13 compras
Versión 1.0, Nov 2024
Windows, Mac
4.3
Valoraciones: 3

Descripción
Este Indicador de Brecha de Valor Justo (FVG) es una herramienta de análisis técnico que ayuda a los traders a identificar desequilibrios de precio.
Características:
- Alternar la visibilidad de brechas alcistas y/o bajistas
- Muestra cuadros codificados por colores para una visualización fácil (predeterminado: verde para alcistas, rojo para bajistas, dorado para niveles intermedios)
- Periodo de retroceso ajustable para reducir el desorden en el gráfico
- Configuración ajustable de extensión del cuadro (offset) para mejor visualización
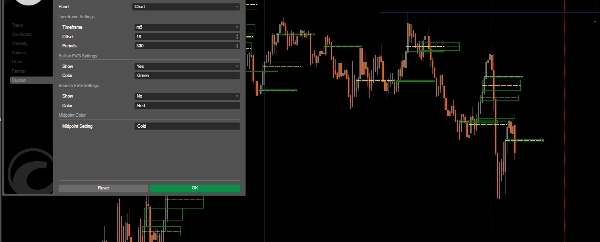
Parámetros:
- Marco temporal: Seleccione su marco temporal preferido para mostrar los FVG
- Offset: Ajuste la extensión horizontal de los cuadros FVG (3-500)
- Periodos: Establezca el periodo de retroceso para el cálculo histórico de FVG
- Mostrar FVGs Alcistas/Bajistas
- Colores: Personalice los colores para los FVGs alcistas, bajistas y las líneas intermedias
Aplicaciones de Trading:
- Soporte y Resistencia: Los FVGs a menudo actúan como niveles fuertes de soporte/resistencia
- Imanes de Precio: Las brechas no llenadas tienden a atraer la acción del precio (DOL)
- Estructura del Mercado: Ayuda a identificar zonas potenciales de reversión y puntos de continuación de interés
- Análisis de Bloques de Orden: Detecta zonas de trading institucional
Mejores Prácticas de Aplicación:
- Usar junto con otras herramientas de análisis técnico.
- Los marcos temporales más altos producen FVGs más significativos, los marcos temporales más bajos se usan con la Tendencia Direccional de marcos temporales más altos
- Monitorear cómo reacciona el precio al regresar a las zonas FVG
- Prestar atención a la línea intermedia ya que a menudo sirve como imán de precio
Consulta otros indicadores útiles que he publicado. Si encuentras útil este u otros de mis indicadores, considera apoyar mi trabajo comprando o donando. Tu apoyo no solo me ayuda a continuar desarrollando y mejorando estas herramientas, sino que también asegura que pueda seguir creando nuevos indicadores valiosos para mejorar tu experiencia de trading. ¡Gracias por tu apoyo continuo!
https://buymeacoffee.com/tidypips
Resumen
Resumen de IA
The FVG_tidypips indicator is a technical analysis tool designed to identify Fair Value Gaps (FVGs), which represent price imbalances on trading charts. It visually highlights bullish and bearish gaps using color-coded boxes—green for bullish, red for bearish, and gold for midpoint levels—facilitating quick recognition of potential support and resistance zones. Users can toggle the visibility of bullish and/or bearish gaps, adjust the lookback period to manage chart clutter, and configure the horizontal extension (offset) of the FVG boxes for clearer visualization.
Key parameters include selecting the timeframe for FVG display, setting the offset range (3–500), defining the lookback period for historical gap calculation, and customizing colors for different gap types and midpoint lines. The indicator supports trading applications such as identifying strong support/resistance levels, spotting price magnets where unfilled gaps attract price action, analyzing market structure for potential reversal or continuation zones, and detecting institutional order block areas.
Best practices recommend using this indicator alongside other technical tools, focusing on higher timeframes for more significant FVGs, and monitoring price reactions when revisiting FVG zones. The midpoint line is noted as an important price magnet. This tool is applicable across various markets, including commodities like gold (XAUUSD).
Perfil del indicador
Valoraciones de clientes
4.3
Valoraciones: 3
5 | 33 % | |
4 | 67 % | |
3 | 0 % | |
2 | 0 % | |
1 | 0 % |
Valoraciones de clientes
November 22, 2024
Good idea with limits for traders who use ICT or SMC concepts. It gives value around smart money style analysis, but zones still need manual validation. A good sample is 20 FVG or order block reactions, with messy 0.705 areas skipped. The zone is more convincing when structure and risk both make sense.
November 21, 2024
November 21, 2024
Small but practical edge for smart money style analysis. it adds structure around liquidity, gaps and market shifts, especially when used for mapping zones before entries. For SMC logic, I trust zones more when 0.5 mitigation, BOS and liquidity sweep line up. The zone is more convincing when structure and risk both make sense.
Conversación
Preguntas frecuentes
Commodities
XAUUSD
Los productos disponibles a través de cTrader Store, incluidos bots, indicadores y plugins para operar, son proporcionados por desarrolladores de terceros y están disponibles únicamente con fines informativos y de acceso técnico. cTrader Store no es un bróker, por lo que no proporciona asesoramiento de inversión, recomendaciones personales ni ninguna garantía de rentabilidad futura.
Más de este autor


Precio
15
Ventas
4.6K
Instalaciones gratis